Function Monitoring
FunctionGraph is interconnected with Cloud Eye, allowing you to view function metrics without the need for any configurations.
Function Metrics
FunctionGraph presents the monitoring information of all functions or of a single function created using your account.
- Account-level metrics
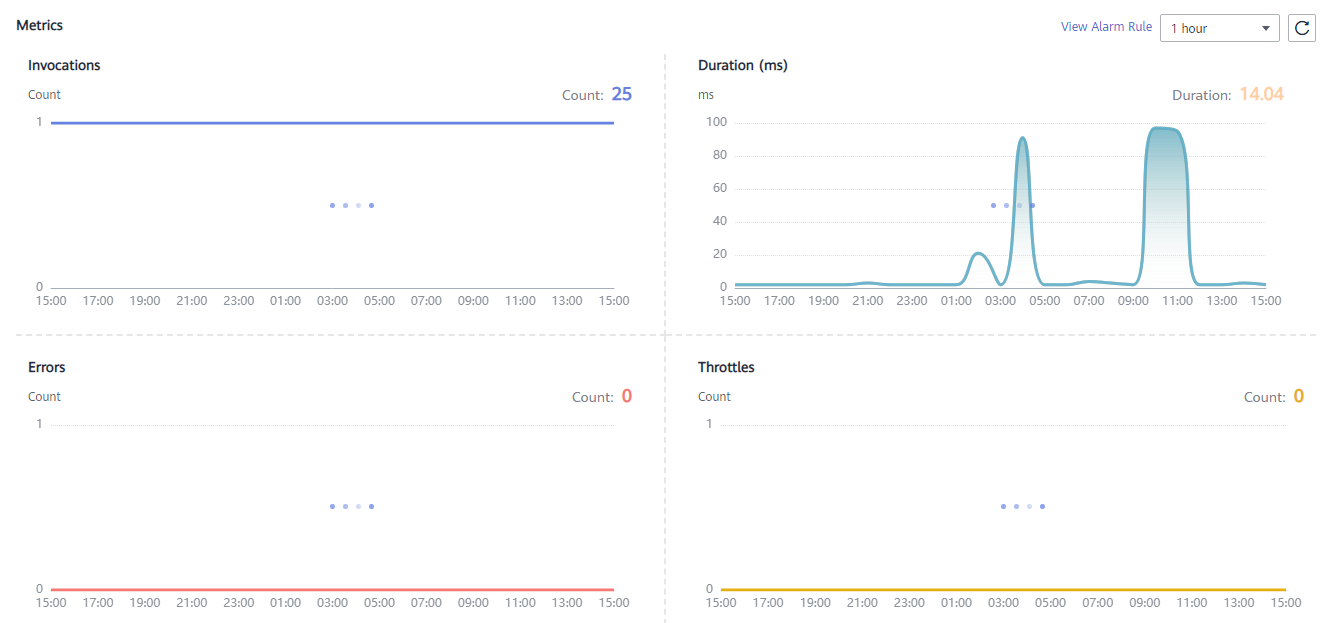
The Dashboard page allows you to view metrics of all functions. The metrics include invocation count, execution duration (including the maximum, average, and minimum durations), invocation errors, and throttled invocations, as shown in Figure 1. For details, see Dashboard.
Figure 1 Account-level metrics
- Function-level metrics
FunctionGraph differentiates the metrics of a function by version, allowing you to query the metrics of a specific function version.
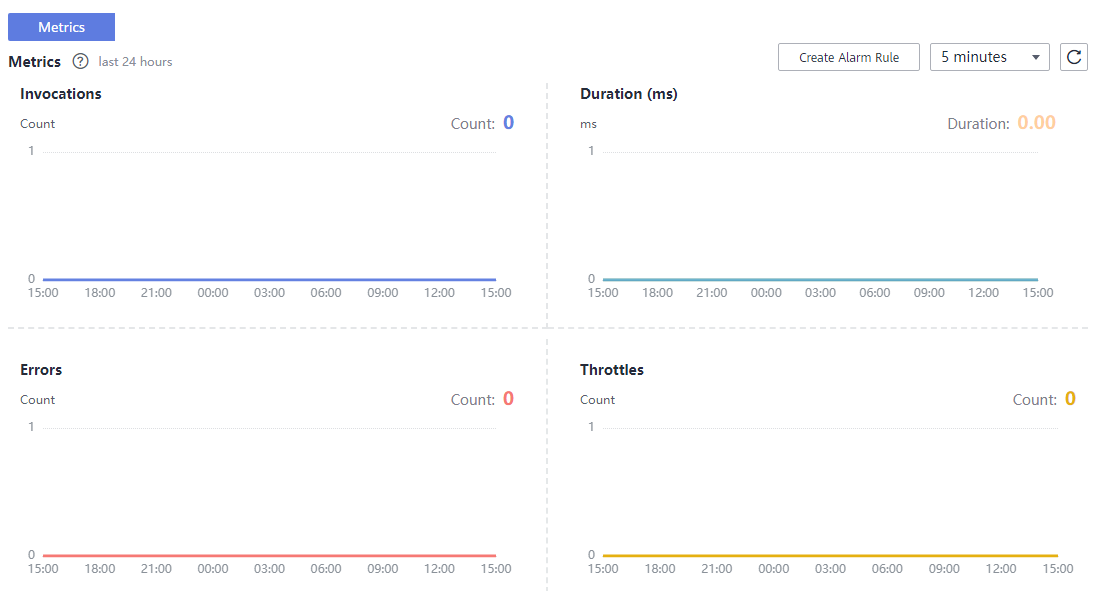
View the metrics on the Monitoring tab page of a function. The metrics include invocation count, execution duration (including the maximum, average, and minimum durations), invocation errors, and throttled invocations, as shown in Figure 2. For details, see Viewing Function Metrics.
Figure 2 Function-level metrics
- Creating an alarm rule
Create an alarm rule for a function to report metrics to Cloud Eye for better monitoring.
On the Monitoring tab page of the function details page, click Create Alarm Rule. Select a metric and set an alarm policy. After the alarm rule is created, click View details in the displayed message to view details of the alarm rule on the Cloud Eye console. On the Alarm Rules page, click View Graph in the Operation column of the alarm rule to view function metrics. Figure 3 shows the function monitoring graph.
Figure 3 Viewing the monitoring graph

- Function Metrics