SFS Metrics
This section describes only the monitoring metrics of SFS Capacity-Oriented.
Function
This section describes metrics reported by Scalable File Service (SFS) as well as their namespaces and dimensions. You can use the console or APIs provided by Cloud Eye to query the metrics generated for SFS.
Namespace
SYS.SFS
Metrics
Metric ID | Metric Name | Description | Value Range | Monitored Object | Monitoring Period (Raw Data) |
|---|---|---|---|---|---|
read_bandwidth | Read Bandwidth | Read bandwidth of a file system within a monitoring period Unit: byte/s | ≥ 0 bytes/s | SFS file system | 4 minutes |
write_bandwidth | Write Bandwidth | Write bandwidth of a file system within a monitoring period Unit: byte/s | ≥ 0 bytes/s | SFS file system | 4 minutes |
rw_bandwidth | Read and Write Bandwidth | Read and write bandwidth of a file system within a monitoring period Unit: byte/s | ≥ 0 bytes/s | SFS file system | 4 minutes |
Dimension
Key | Value |
|---|---|
share_id | SFS file system |
Viewing Monitoring Statistics
- Log in to the management console.
- Choose Management & Deployment > Cloud Eye > Cloud Service Monitoring > Scalable File Service. In the file system list, click View Metric in the Operation column of the desired file system.
- View the SFS file system monitoring data by metric or monitored duration.
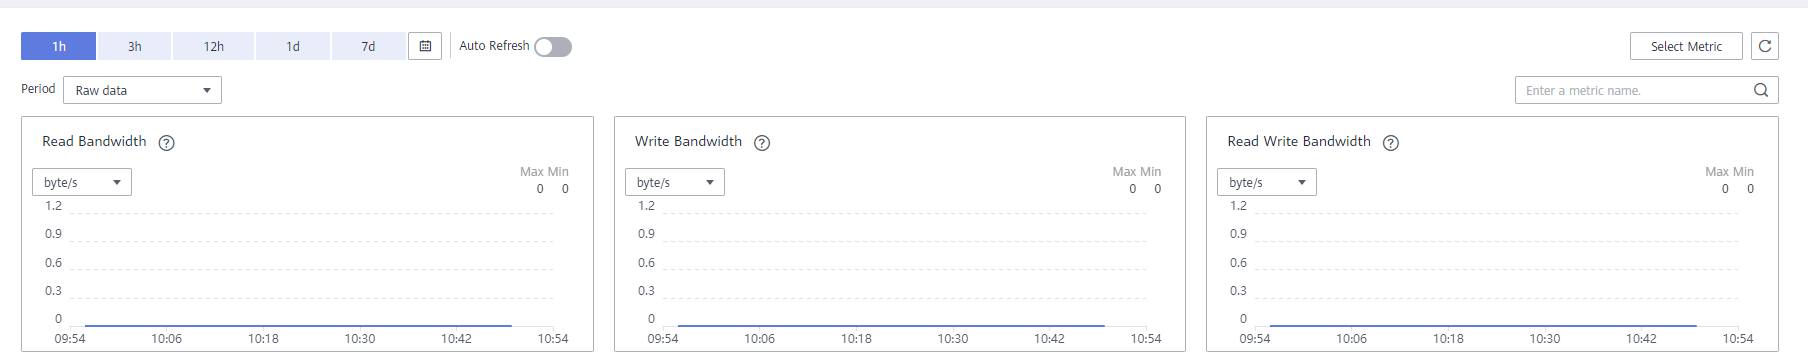
Figure 1 shows the monitoring graphs. For more information about Cloud Eye, see the Cloud Eye User Guide.
Figure 1 SFS monitoring graphs
- Function
- Namespace
- Metrics
- Dimension
- Viewing Monitoring Statistics