How Can I Locate the Root Cause If a Workload Is Abnormal?
If a workload is abnormal, you can check the pod events first to locate the fault and then rectify the fault.
Fault Locating
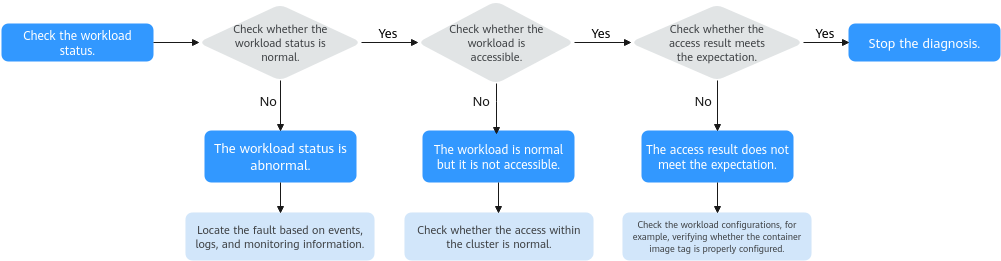
To locate the fault of an abnormal workload, take the following steps:
- Check whether the workload pod is running properly.
- Log in to the CCE console.
- Click the cluster name to access the cluster console. In the navigation pane, choose Workloads.
- In the upper left corner of the page, select the namespace, locate the target workload, and view its status.
- If the workload is not ready, you can view pod events to determine the cause. For details, see Viewing Pod Events. You can find the solution to the issue based on the events by referring to Common Pod Issues.
- If the workload is processing, wait patiently.
- If the workload is running, but it is not accessible, check whether intra-cluster access is normal.
- Check whether access within the cluster is normal.
Log in to the CCE console or use kubectl to obtain the pod IP address. Then, log in to the node or the pod and run curl or use other methods to manually call the APIs and check whether the intra-cluster communication is normal.
If {Container IP address}:{Port number} is not accessible, log in to the service container, and attempt to access 127.0.0.1:{Port number}.
- Check whether the expected results are displayed.
If the workload is accessible within the cluster but the expected results are not shown, check the workload configurations, such as verifying if the image tag and environment variables are correctly configured.
Common Pod Issues
Status | Description | Reference |
|---|---|---|
Pending | The pod scheduling failed. | |
Pending | A storage volume fails to be mounted to a pod. | |
FailedPullImage ImagePullBackOff | The image pull failed. The image failed to be pulled again. | |
CreateContainerError CrashLoopBackOff | The container startup failed. The container failed to restart. | |
Evicted | A pod is in the Evicted state, and the pod keeps being evicted. | |
Creating | A pod is in the Creating state. | |
Terminating | A pod is in the Terminating state. | |
Stopped | A pod is in the Stopped state. |
Viewing Pod Events
Method 1
On the CCE console, click the workload name to go to the workload details page, locate the row containing the abnormal pod, and choose More > View Events in the Operation column.
Method 2
Use the kubectl command:
kubectl describe pod {pod-name}
Information similar to the following is displayed:
...Events:Type Reason Age From Message---- ------ ---- ---- -------Warning FailedScheduling 49s default-scheduler 0/2 nodes are available: 2 Insufficient cpu.Warning FailedScheduling 49s default-scheduler 0/2 nodes are available: 2 Insufficient cpu.
- Fault Locating
- Common Pod Issues
- Viewing Pod Events