Dashboard
The Dashboard page provides visibility into the protection status of cloud servers, risk statistics on protected servers within the last 24 hours, risk statistics of the last week, and top 5 vulnerable servers of the last week.
Risk Statistics on Protected Servers (Last 24 Hours)
Figure 1 Risk statistics on protected servers (last 24 hours)
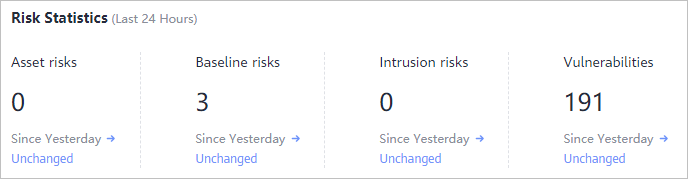
You can check the number of risks detected for protected servers over the past 24 hours.
Server Protection Status (Last 24 Hours)
Figure 2 Server protection status
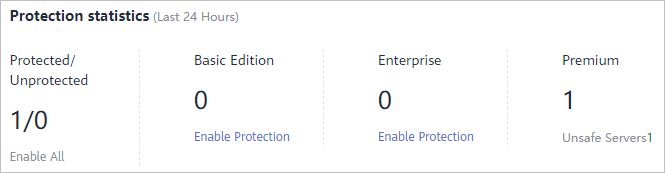
You can check the numbers of servers protected with the basic, enterprise, or premium edition and the number of unprotected servers.
To enable protection for required servers, click Enable All.
Risks
Figure 3 Risks
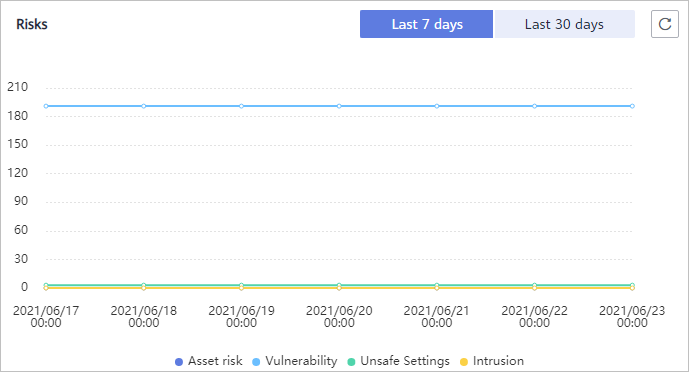
You can check risk statistics in the last 7 days or 30 days.
Category | Item |
|---|---|
Asset |
|
Vulnerability |
|
Unsafe setting |
|
Intrusion |
|
Handled Risks (Last 7 Days)
Figure 4 Handled risks
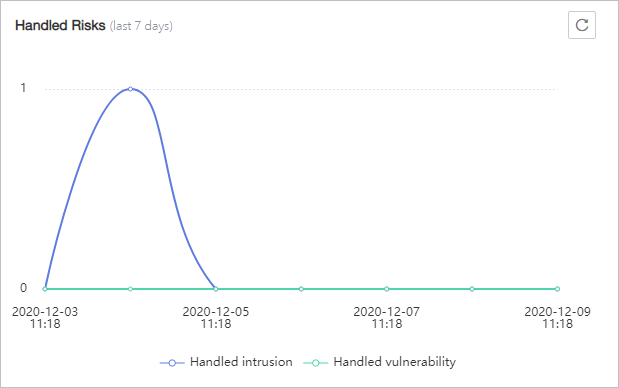
You can check the intrusions and vulnerabilities handled in the last seven days.
Intrusions
Figure 5 Intrusions
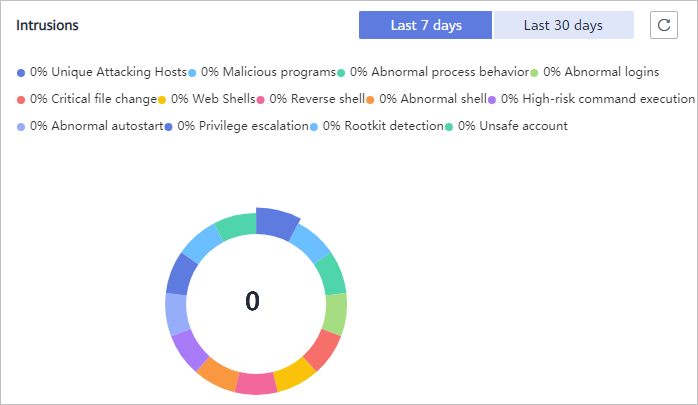
You can check the numbers and types of intrusions in the last seven or 30 days.
These intrusion statistics are updated at 00:00 a.m. every day.
Top 5 Unsafe Servers (Last 7 Days)
Figure 6 Top 5 unsafe servers (last 7 days)
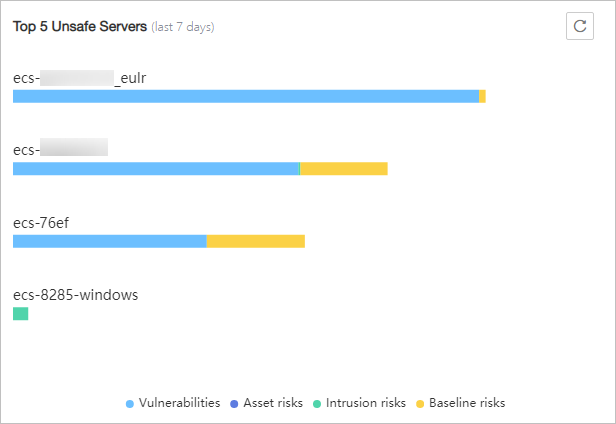
If you have enabled the basic, enterprise, or premium edition HSS, you can check the top 5 unsafe servers, which have the most risks detected in the past week, and the numbers of each type of risks.
At 00:00 every morning, server risks and the five servers with highest risks in the past seven days are updated.
Real-time Intrusions
Figure 7 Real-time intrusions

You can check the latest five intrusion events that have not been processed in the last 24 hours, including their alarm names, affected server names/IP addresses, description, occurrence time, and status.
- To check alarm details, click an alarm name.
- To handle an alarm, click Handle in the Operation column of the alarm. After the alarm is handled, it will be removed from the list. The list refreshes and displays the latest five intrusion events that have not been handled in the last seven days.
- To check more alarm events, click View more to go to the Events page.
- Risk Statistics on Protected Servers (Last 24 Hours)
- Server Protection Status (Last 24 Hours)
- Risks
- Handled Risks (Last 7 Days)
- Intrusions
- Top 5 Unsafe Servers (Last 7 Days)
- Real-time Intrusions