How Do I Enable or Disable Metric Collection by Modifying the Configuration File?
This following describes how to enable or disable metric collection by modifying the configuration file.
Modifying the Configuration File to Enable Metric Collection
- Log in to a server as user root.
- Modify the configuration file.
cd /usr/local/uniagent/extension/install/telescope/conf && vi custom_conf.json
Enter the following configuration content in {}. For details about contents in italic, see the metric values in "OS Monitoring Metrics Supported by ECSs with the Agent Installed" in Elastic Cloud Server User Guide.
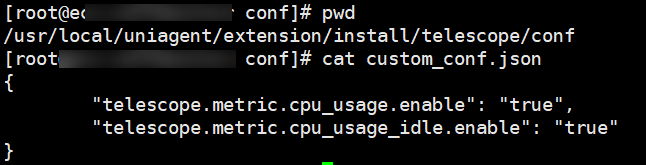
"telescope.metric.metric_name1.enable": "true","telescope.metric.metric_name2.enable": "true"Example: Figure 1 shows the configuration content for enabling metric collection for cpu_usage and cpu_usage_idle.
Figure 1 Enabling metric collection for cpu_usage and cpu_usage_idle
- Restart the Agent.
cd /usr/local/uniagent/extension/install/telescope && ./telescoped restart
Modifying the Configuration File to Disable Metric Collection
- Log in to a server as user root.
- Modify the configuration file.
cd /usr/local/uniagent/extension/install/telescope/conf && vi custom_conf.json
Enter the following configuration content in {}. For details about contents in italic, see the metric values in "OS Monitoring Metrics Supported by ECSs with the Agent Installed" in Elastic Cloud Server User Guide.
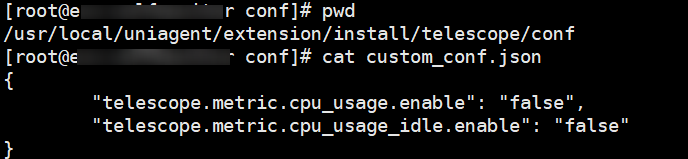
"telescope.metric.metric_name1.enable": "false","telescope.metric.metric_name2.enable": "false"Example: Figure 2 shows the configuration content for disabling metric collection for cpu_usage and cpu_usage_idle.
Figure 2 Disabling metric collection for cpu_usage and cpu_usage_idle
- Restart the Agent.
cd /usr/local/uniagent/extension/install/telescope && ./telescoped restart
- Modifying the Configuration File to Enable Metric Collection
- Modifying the Configuration File to Disable Metric Collection