How Can I Locate a Fault That Occurs with a Node?
Fault Locating
CCE allows you to locate a node fault using the CCE Node Problem Detector add-on (Locating a Node Fault Using the CCE Node Problem Detector Add-on). You can also refer to Locating a Node Fault by Performing a Self-Check to locate the fault.
If the fault persists, submit a service ticket.
Locating a Node Fault by Performing a Self-Check
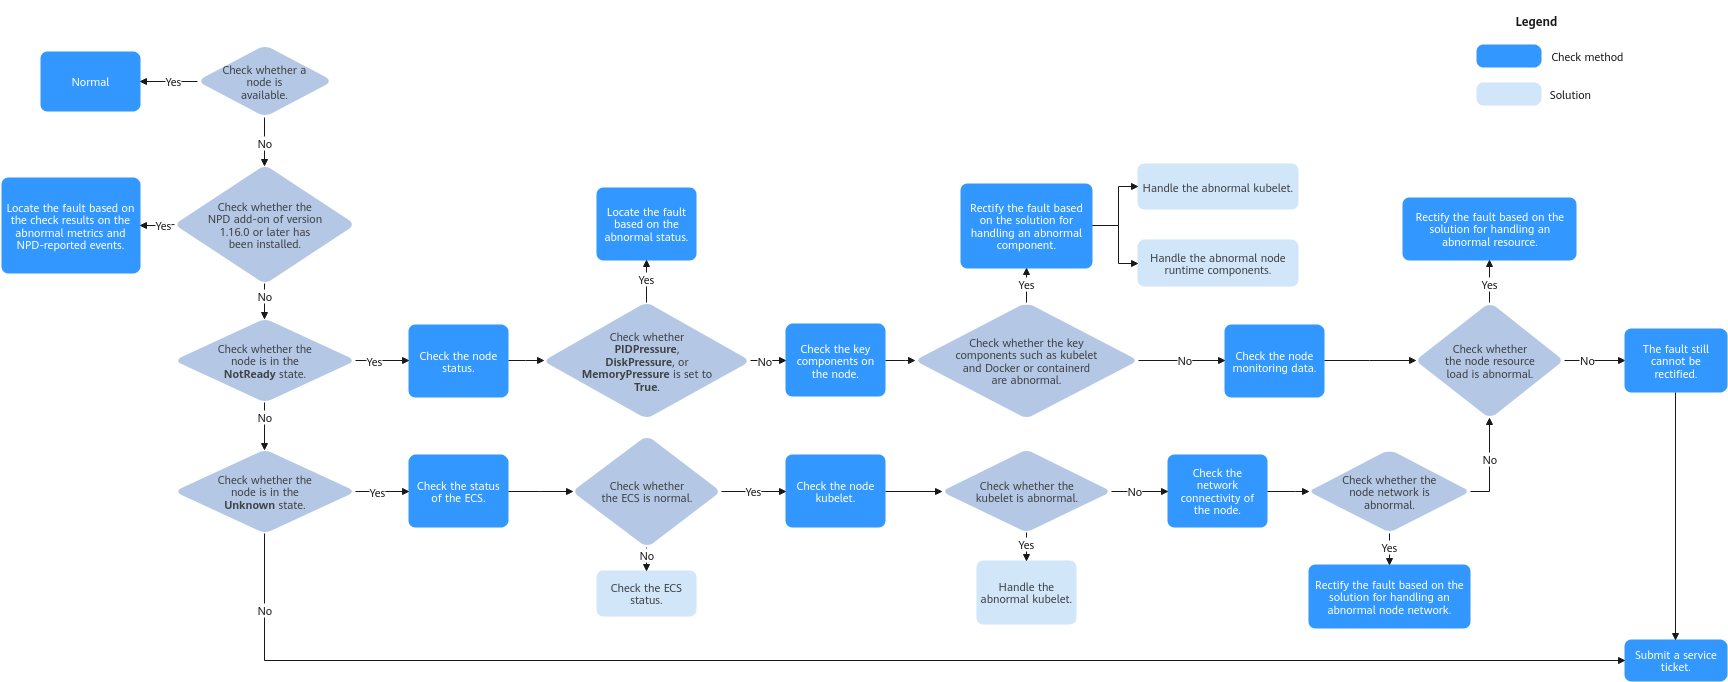
Figure 1 Performing a self-check
- Log in to the CCE console.
- Click the cluster name to access the cluster console. Choose Nodes in the navigation pane. In the right pane, click the Nodes tab.
- Locate the row containing the target node, choose More > View YAML in the Operation column, and check the Status field of the node.
The node is in the NotReady state.
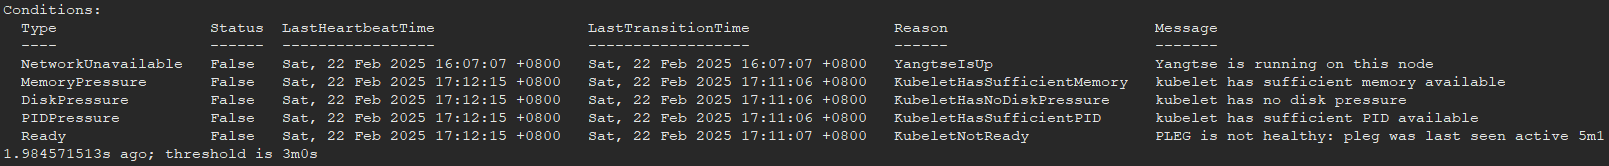
- Check the node status and verify whether the value of PIDPressure, DiskPressure, or MemoryPressure becomes True. If any of them becomes True, you can find the appropriate solution based on the exception keyword.
- Check the key components on the node and the logs of these components. The key components on a node include a kubelet and the node runtime (Docker or containerd). For details, see Checking Key Components of the Node.
- Check the kubelet.
Check whether the kubelet and its logs are normal. If there is an exception, see Abnormal kubelet.
- Check the runtime (Docker or containerd).
- Check the runtime of the node. If you are not sure whether the runtime is Docker or containerd, log in to the CCE console and view the runtime of the node.
- If there is an exception, see Abnormal Runtime.
- Check the NTP.
- Check whether the NTP, its logs, and the configurations are normal.
- If there is an exception, see Abnormal NTP.
- Check the kubelet.
- Check the node monitoring data and see whether the CPU, memory, and network resources of the node are normal. If there is an exception, rectify the fault by referring to Memory Pressure.
The node is in the Unknown state.
- Log in to the ECS console and check whether the node is present in the ECS list.
- Check whether the node is running properly.
- Check the key components on the node and the logs of these components. The key components on a node include a kubelet and the node runtime (Docker or containerd). For details, see Checking Key Components of the Node.
- Check the kubelet.
- Check whether the kubelet and its logs are normal. If there is an exception, see Abnormal kubelet.
- Check the kubelet.
- Check the network connectivity of the node.
Common Problems and Troubleshooting Methods
- Checking a Node
- Checking the Node Monitoring Data
- Checking the Node Events
- Verifying Whether the ECS Has Been Deleted or Is Faulty
- Verifying Whether the ECS Can Be Logged In
- Checking the Node Security Group
- Checking the Disks Attached to the Node
- Checking Key Components of the Node
- Verifying Whether the Node DNS Address Is Properly Configured
Checking Key Components of the Node
kubelet
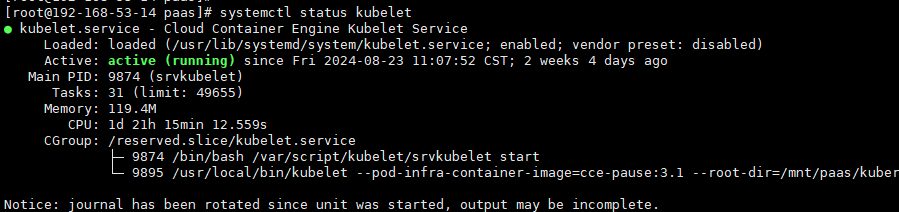
- Check the kubelet.
Log in to the target node, run the following command on it, and check the kubelet:
systemctl status kubeletThe following shows an example of the expected output.
- View the kubelet logs.
Log in to the target node, run the following command on it, and check the kubelet:
journalctl -u kubelet
Runtime
- Docker
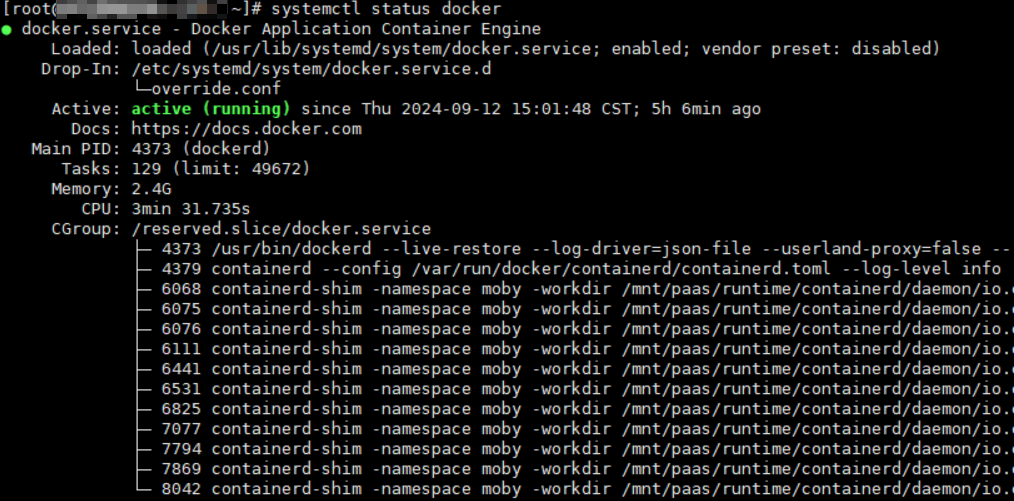
- Check the Docker runtime.
Log in to the target node, run the following command on it, and check the Docker process:
systemctl status dockerThe following shows an example of the expected output.
- View the Docker logs.
Log in to the target node, run the following command on it, and check the Docker logs:
journalctl -u docker
- Check the Docker runtime.
- containerd
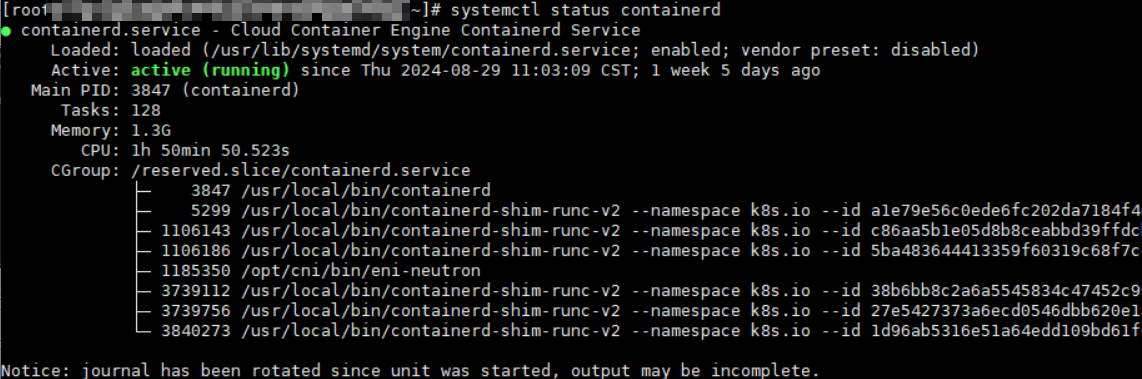
- Check the containerd runtime.
Log in to the target node, run the following command on it, and check the containerd process:
systemctl status containerdThe following shows an example of the expected output.
- View the containerd logs.
Log in to the target node, run the following command on it, and check the containerd logs:
journalctl -u containerd
- Check the containerd runtime.
- NTP
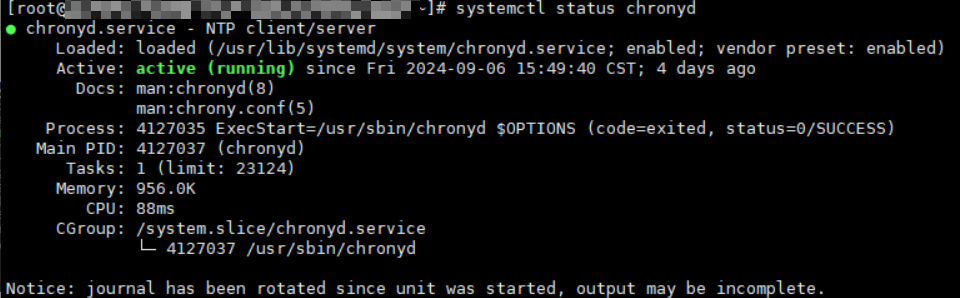
- Check whether the NTP is normal.
Log in to the target node, run the following command on it, and check the chronyd process:
systemctl status chronydThe following shows an example of the expected output.
- View the NTP logs.
Log in to the target node, run the following command on it, and check the NTP logs:
journalctl -u chronyd
- Check whether the NTP is normal.
Common Issues and Solutions
Abnormal Node Restart
Possible cause
The node is experiencing abnormal load.
Symptom
During the restart, the node is in the NotReady state.
Solution
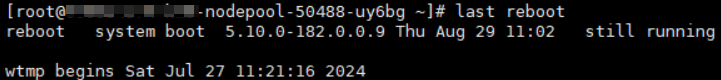
- Check the time when the node was restarted:last reboot
The following shows an example of the expected output.
- View the node monitoring data and locate the abnormal resource based on the restart time of the node. For details, see Checking the Node Monitoring Data.
- Check the kernel logs and locate the fault based on the restart time.
Node Unavailable Due to OOM
Possible cause
Many containers are scheduled onto a node, using up all its resources and causing an OOM issue. This issue is primarily seen on nodes running the Docker container engine.
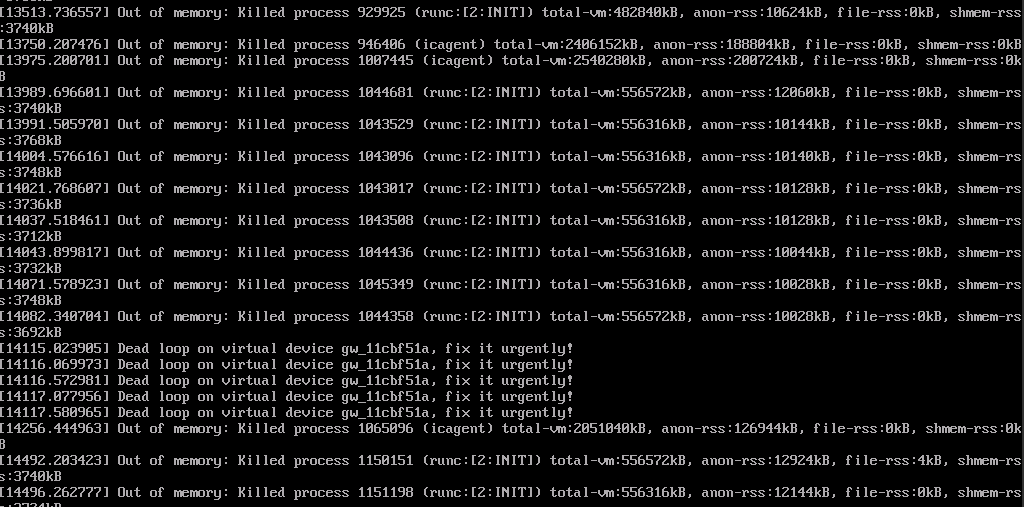
Symptom
If a node in the cluster is assigned too many containers, the node OS might crash, rendering the node unavailable. You may see the information similar to the following after logging in to the node with VNC.
Check the node events:
kubectl describe node {nodeName}
Pay attention to the abnormal node events in the output.
Solution
If the resources on a node are not enough for pod scheduling, reduce the node load through either of the following ways:
- Reset the faulty node.
- Delete unnecessary pods.
- Restrict the resource configurations of pods based on service requirements.
- Add more nodes to the cluster.
- Fault Locating
- Locating a Node Fault Using the CCE Node Problem Detector Add-on
- Locating a Node Fault by Performing a Self-Check
- Common Problems and Troubleshooting Methods
- Checking a Node
- Checking the Node Monitoring Data
- Checking the Node Events
- Verifying Whether the ECS Has Been Deleted or Is Faulty
- Verifying Whether the ECS Can Be Logged In
- Checking the Node Security Group
- Checking the Disks Attached to the Node
- Checking Key Components of the Node
- Verifying Whether the Node DNS Address Is Properly Configured
- Common Issues and Solutions
- PID Pressure
- Memory Pressure
- Disk Pressure
- Abnormal kubelet
- Abnormal Runtime
- Abnormal NTP
- Abnormal Node Restart
- Abnormal Node Network
- Abnormal PLEG
- Node Overloaded
- Restricted Node Scheduling with the node.kubernetes.io/route-unreachable Taint
- Node Unavailable Due to OOM