Reporting Prometheus Monitoring Data to a Third-Party Monitoring Platform
Application Scenarios
The Cloud Native Cluster Monitoring add-on can report Prometheus metrics collected from clusters to a specified platform, for example, AOM or a third-party platform that supports Prometheus metrics. This section explains how to configure settings for Cloud Native Cluster Monitoring to send collected metrics to a third-party's Prometheus instance.
Step 1: Obtain the Data Reporting Address
Prometheus provides standard Remote Write APIs. You can enter the source address (Remote Write URL) in the Cloud Native Cluster Monitoring add-on for storing the locally collected monitoring data in a Prometheus instance remotely.
- If the Prometheus instance for receiving data is provided by a third-party vendor, view the Remote Write URL on the vendor's console.
- If the Prometheus instance for receiving data is an on-premises one, the Remote Write URL is https:// {prometheus_addr} /api/v1/write, where {prometheus_addr} indicates the IP address and port number for external access.
Step 2: Obtain the Authentication Mode
- For the third-party Prometheus instance, go to the vendor's console to view the token or account password used for authorized access.
- For the on-premises Prometheus instance, perform the following steps to obtain a token:
- If this Prometheus instance is deployed in a Kubernetes cluster, view the token in the corresponding container. If this Prometheus instance is deployed on a VM, skip this step.kubectl exec -ti -n monitoring prometheus-server-0 -- sh
Replace the variables in the command as needed:
- monitoring: indicates the namespace where a Prometheus pod is in.
- prometheus-server-0: indicates the name of a Prometheus pod.
- Check the location of the configuration file.ps -aux | grep prometheus
Information similar to the following is displayed:

- View and record the token information in prometheus.env.yaml.cat /etc/prometheus/config_out/prometheus.env.yaml
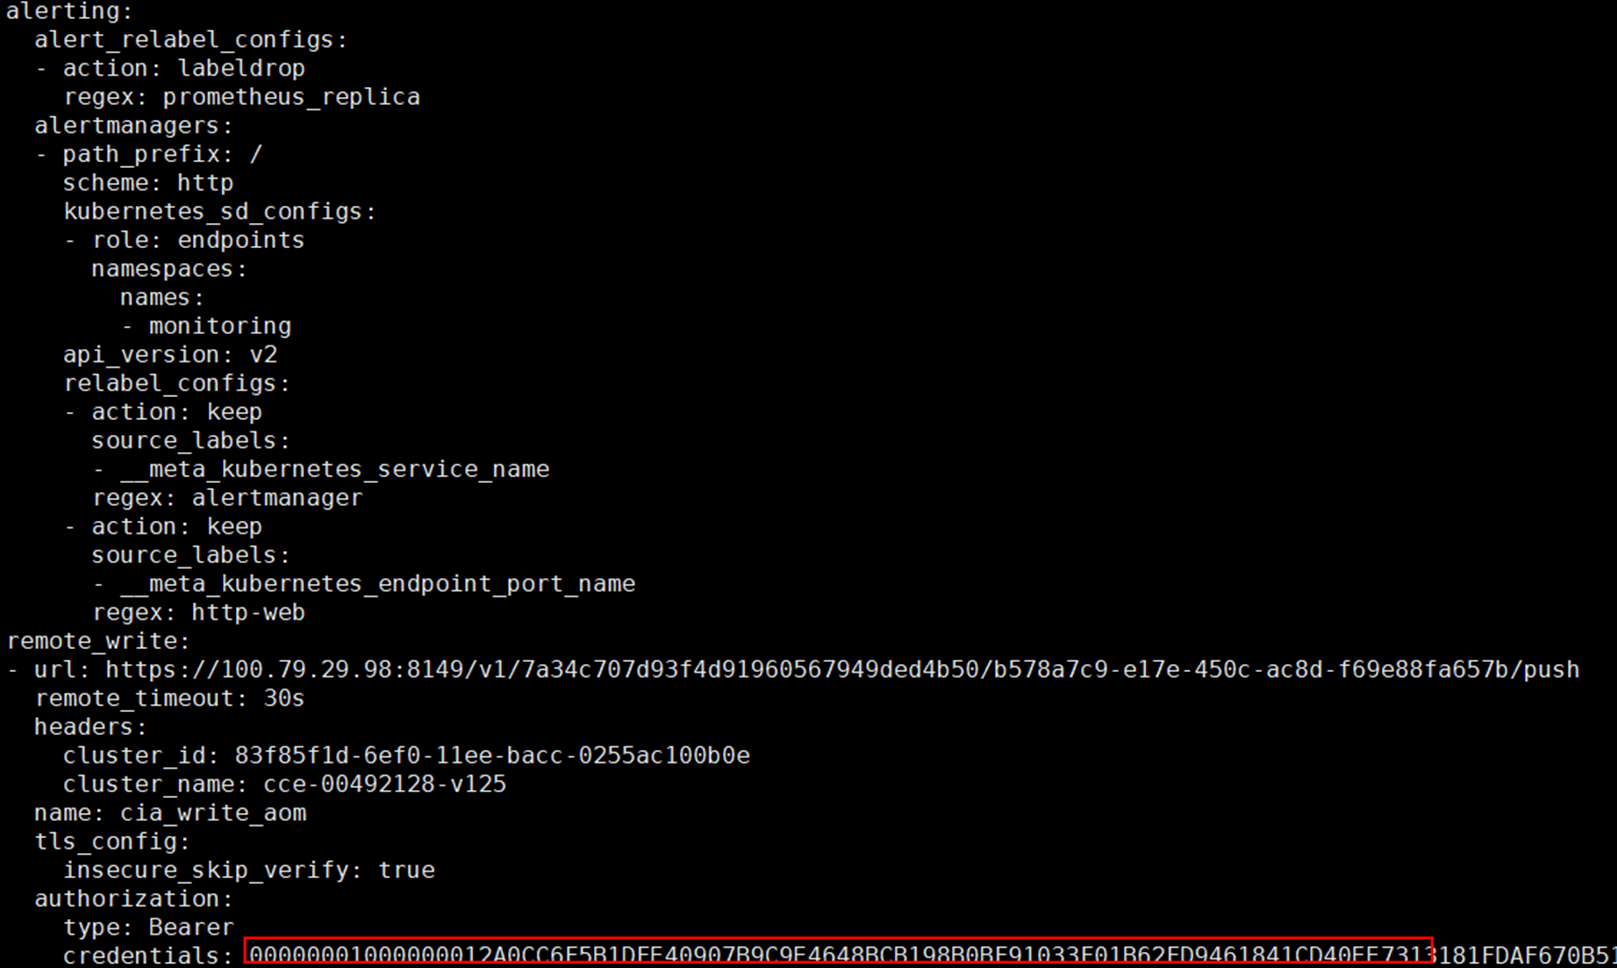
- If this Prometheus instance is deployed in a Kubernetes cluster, view the token in the corresponding container. If this Prometheus instance is deployed on a VM, skip this step.
Step 3: Connect to a Third-Party Monitoring Platform
- Log in to the CCE console, click the name of a cluster with the Cloud Native Cluster Monitoring add-on installed to access the cluster console.
- In the navigation pane, choose Add-ons, locate the Cloud Native Cluster Monitoring add-on, and click Edit.
- Enable Report Monitoring Data to a Third-Party Platform so that the data collected by Cloud Native Cluster Monitoring can be reported to a third-party monitoring platform.
- Source Address: Remote Write URL obtained in step 1, for example, https://127.0.0.1:9090/api/v1/write.
- Authentication method: Select the authentication method supported by the third-party monitoring platform in step 2.
- Basic Auth: Enter the user name and password.
- Bearer Token: Enter the identity credential (token).
- After the modification is complete, click OK.
Step 4: Check the Data Sending and Receiving Statuses
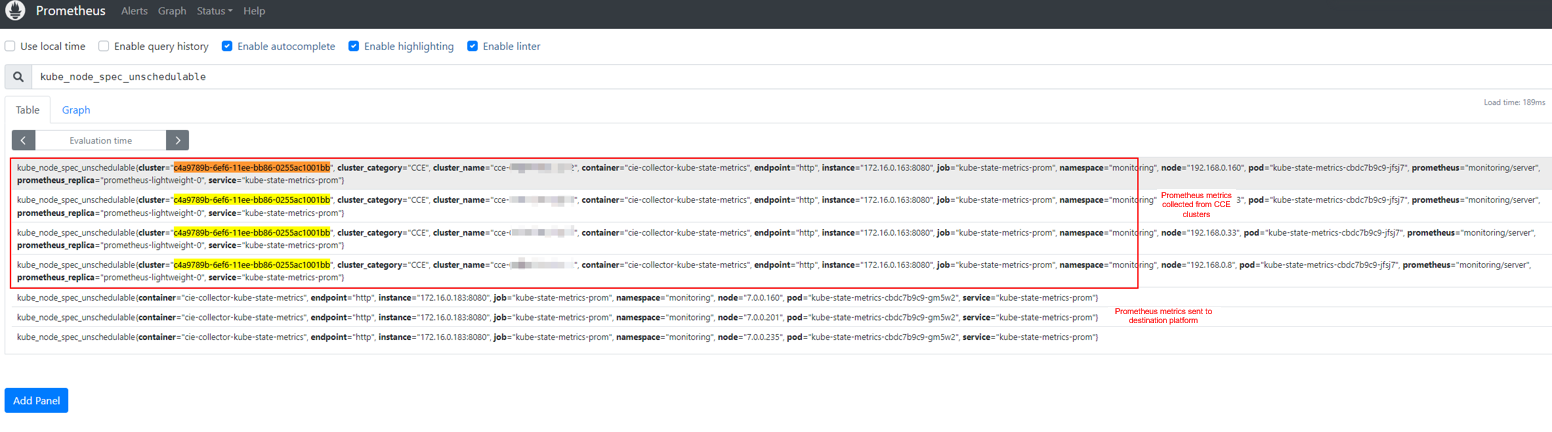
After the preceding configuration is complete, log in to the Prometheus console supported by the third-party platform and view the Prometheus metrics with remote write on the Graph page.
- Application Scenarios
- Step 1: Obtain the Data Reporting Address
- Step 2: Obtain the Authentication Mode
- Step 3: Connect to a Third-Party Monitoring Platform
- Step 4: Check the Data Sending and Receiving Statuses