Monitoring Multiple Clusters Using Prometheus
Application Scenarios
Generally, a user has different clusters for different purposes, such as production, testing, and development. To monitor, collect, and view metrics of these clusters, you can deploy a set of Prometheus.
Solution Architecture
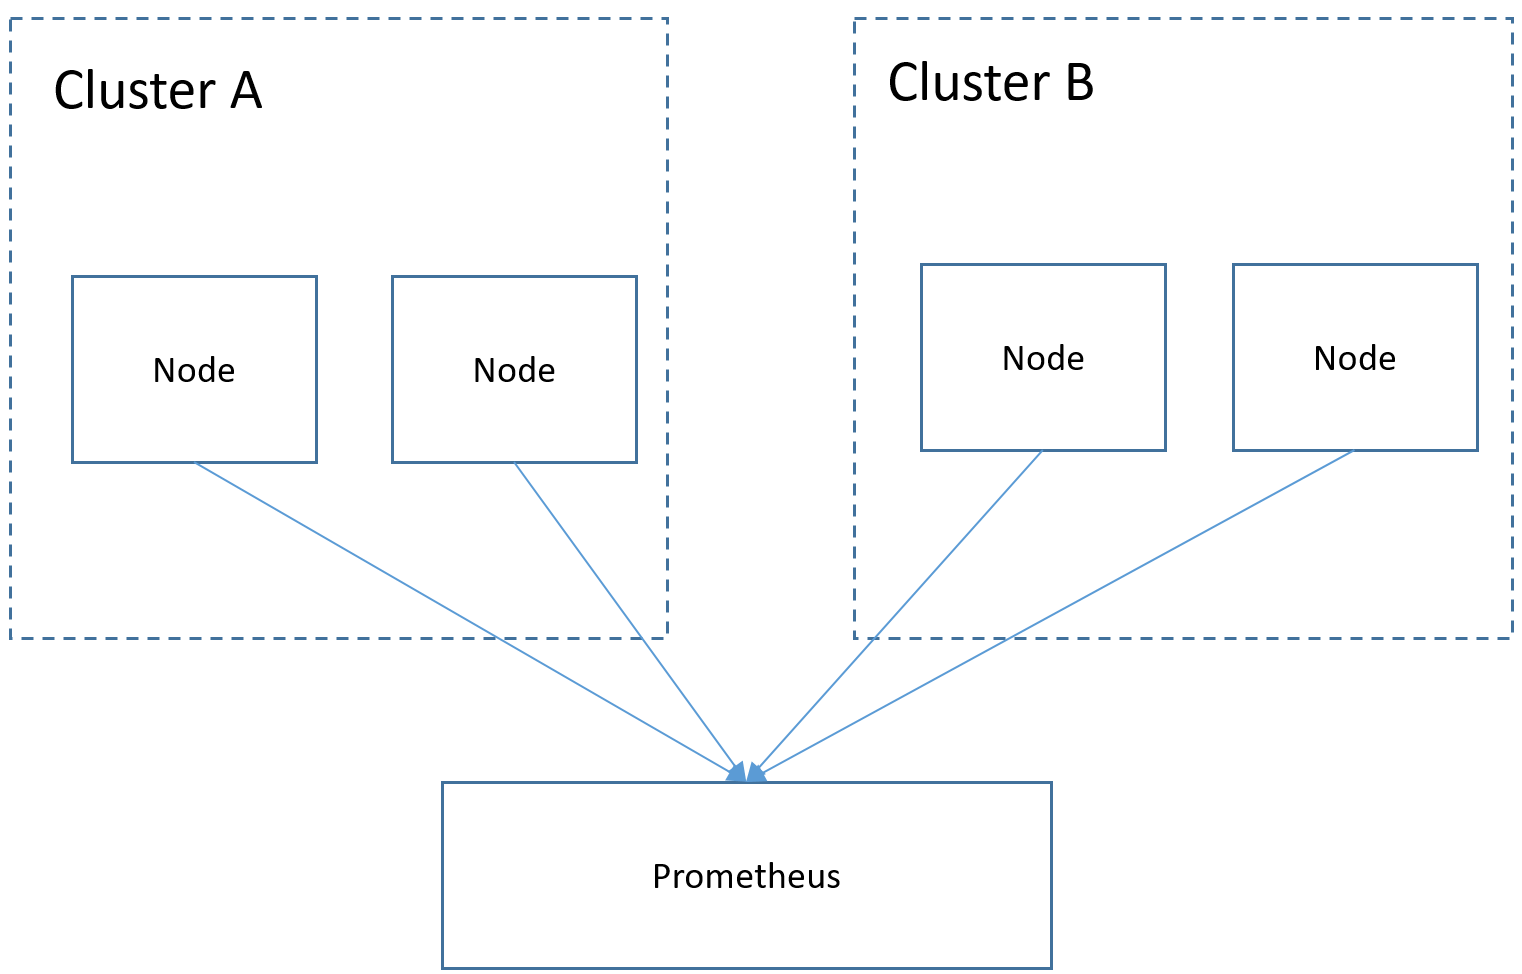
Multiple clusters are connected to the same Prometheus monitoring system, as shown in the following figure. This reduces maintenance and resource costs and facilitates monitoring information aggregation.
Prerequisites
- The target cluster has been created.
- Prometheus has been properly connected to the target cluster.
- Prometheus has been installed on a Linux host using a binary file. For details, see Installation.
Procedure
- Obtain the bearer_token information of the target cluster.
- Create the RBAC permission in the target cluster.
Log in to the background node of the target cluster and create the prometheus_rbac.yaml file.
apiVersion: v1kind: ServiceAccountmetadata:name: prometheus-testnamespace: kube-system---apiVersion: rbac.authorization.k8s.io/v1kind: ClusterRolemetadata:name: prometheus-testrules:- apiGroups:- ""resources:- nodes- services- endpoints- pods- nodes/proxyverbs:- get- list- watch- apiGroups:- "extensions"resources:- ingressesverbs:- get- list- watch- apiGroups:- ""resources:- configmaps- nodes/metricsverbs:- get- nonResourceURLs:- /metricsverbs:- get---apiVersion: rbac.authorization.k8s.io/v1kind: ClusterRoleBindingmetadata:name: prometheus-testroleRef:apiGroup: rbac.authorization.k8s.iokind: ClusterRolename: prometheus-testsubjects:- kind: ServiceAccountname: prometheus-testnamespace: kube-systemRun the following command to create the RBAC permission:
kubectl apply -f prometheus_rbac.yaml
- Obtain the bearer_token information of the target cluster.Note
- In clusters earlier than v1.21, a token is obtained by mounting the secret of the service account to a pod. Tokens obtained this way are permanent. This approach is no longer recommended starting from version 1.21. Service accounts will stop auto creating secrets in clusters from version 1.25.
In clusters of version 1.21 or later, you can use the TokenRequest API to obtain the token and use the projected volume to mount the token to the pod. Such tokens are valid for a fixed period. When the mounting pod is deleted, the token automatically becomes invalid.
- If you need a token that never expires, you can also manually manage secrets for service accounts. Although a permanent service account token can be manually created, you are advised to use a short-lived token by calling the TokenRequest API for higher security.
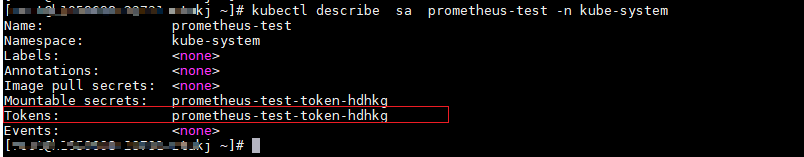
Obtain the serviceaccount information.
kubectl describe sa prometheus-test -n kube-system
kubectl describe secret prometheus-test-token-hdhkg -n kube-system
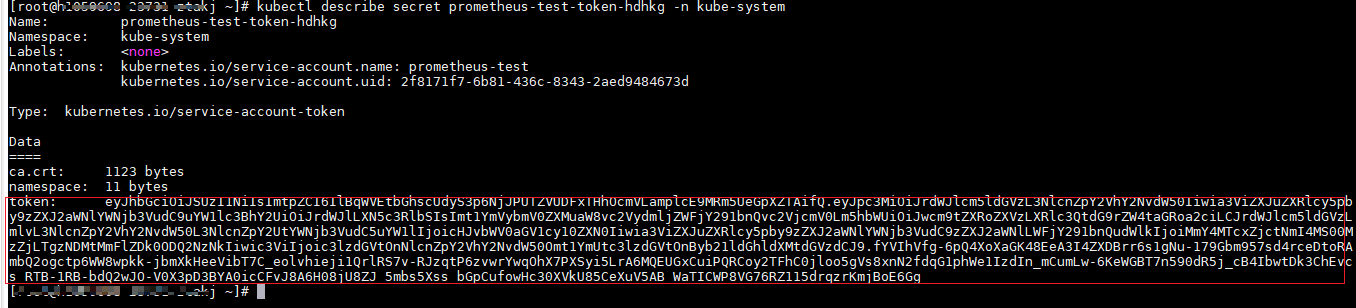
Record the token value, which is the bearer_token information to be collected.
- In clusters earlier than v1.21, a token is obtained by mounting the secret of the service account to a pod. Tokens obtained this way are permanent. This approach is no longer recommended starting from version 1.21. Service accounts will stop auto creating secrets in clusters from version 1.25.
- Create the RBAC permission in the target cluster.
- Configure bearer_token information.
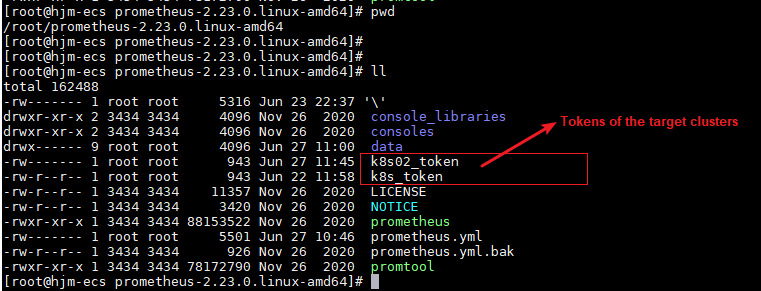
Log in to the host where Prometheus is located, go to the Prometheus installation directory, and save the token information of the target cluster in a file.
- Configure a Prometheus monitoring job.
The example job monitors container metrics. To monitor other metrics, you can add jobs and compile capture rules.
- job_name: k8s_cAdvisorscheme: httpsbearer_token_file: k8s_token # Token file in the previous step.tls_config:insecure_skip_verify: truekubernetes_sd_configs: # kubernetes automatic discovery configuration- role: node # Automatic discovery of the node typebearer_token_file: k8s_token # Token file in the previous stepapi_server: https://192.168.0.153:5443 # API server address of the Kubernetes clustertls_config:insecure_skip_verify: true # Skip the authentication on the server.relabel_configs: ## Modify the existing label of the target cluster before capturing metrics.- target_label: __address__replacement: 192.168.0.153:5443action: replace## Convert metrics_path to /api/v1/nodes/${1}/proxy/metrics/cadvisor.# Obtain data from kubelet using the API server proxy.- source_labels: [__meta_kubernetes_node_name] # Specifies the source label to be processed.regex: (.+) # Matched value of the source label. (.+) indicates that any value of the source label can be matched.target_label: __metrics_path__ # Specifies the label to be replaced.replacement: /api/v1/nodes/${1}/proxy/metrics/cadvisor # Indicates the new label, that is, the value of __metrics_path__. ${1} indicates the value that matches the regular expression, that is, node name.- target_label: clusterreplacement: xxxxx ## (Optional) Enter the cluster information.### The following job monitors another cluster.- job_name: k8s02_cAdvisorscheme: httpsbearer_token_file: k8s02_token # Token file in the previous steptls_config:insecure_skip_verify: truekubernetes_sd_configs:- role: nodebearer_token_file: k8s02_token # Token file in the previous stepapi_server: https://192.168.0.147:5443 # API server address of the Kubernetes clustertls_config:insecure_skip_verify: true # Skip the authentication on the server.relabel_configs: ## Modify the existing label of the target cluster before capturing metrics.- target_label: __address__replacement: 192.168.0.147:5443action: replace- source_labels: [__meta_kubernetes_node_name]regex: (.+)target_label: __metrics_path__replacement: /api/v1/nodes/${1}/proxy/metrics/cadvisor- target_label: clusterreplacement: xxxx ## (Optional) Enter the cluster information. - Enable Prometheus.
After the configuration, enable Prometheus.
./prometheus --config.file=prometheus.yml
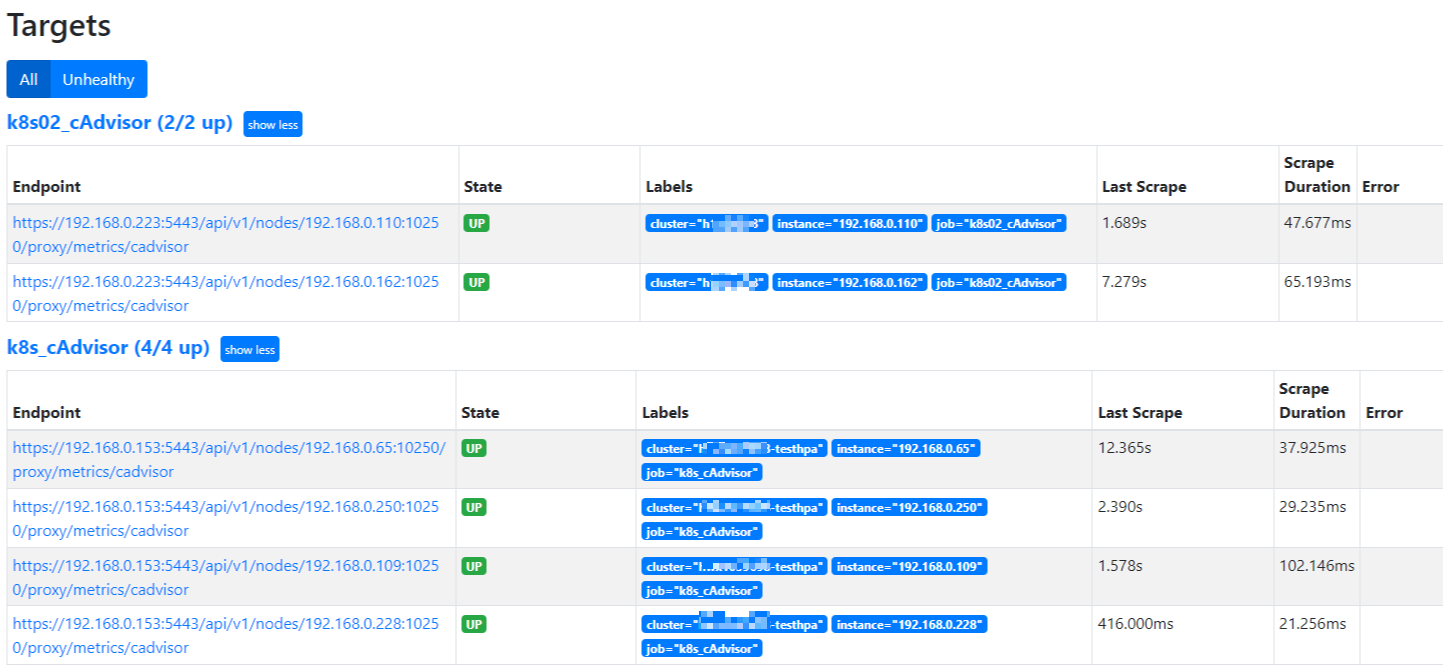
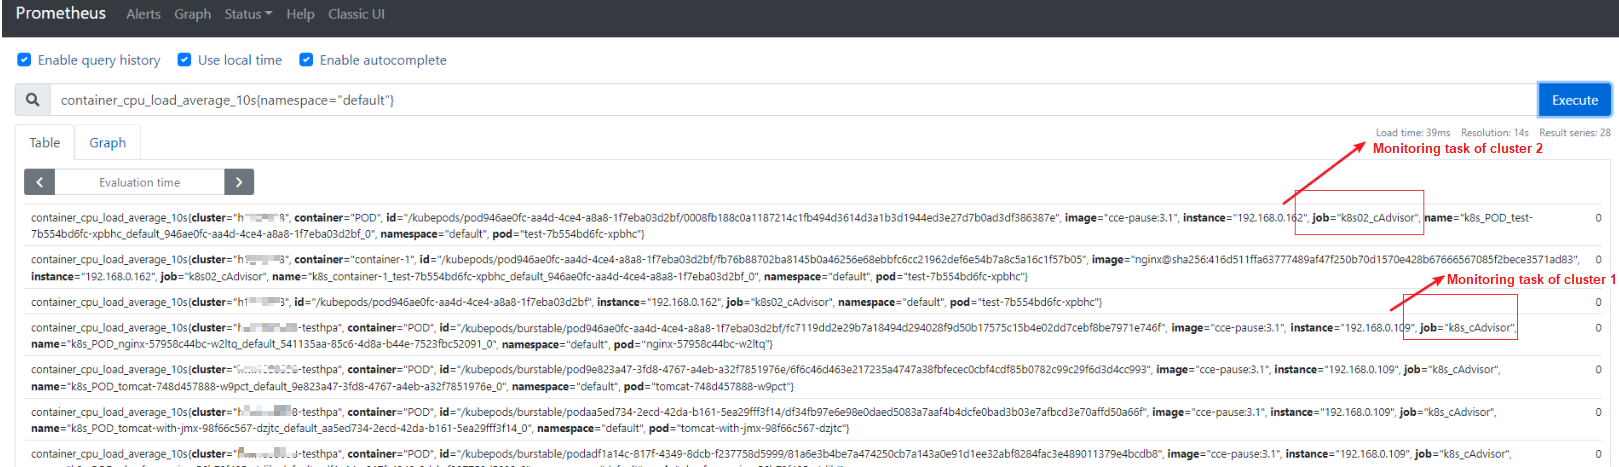
- Log in to Prometheus and view the monitoring information.
- Application Scenarios
- Solution Architecture
- Prerequisites
- Procedure