Load-aware Scheduling
Volcano Scheduler offers CPU and memory load-aware scheduling for pods and preferentially schedules pods to the node with the lightest load to balance node loads. This prevents an application or node failure due to heavy loads on a single node.
Prerequisites
- A cluster of v1.21 or later is available. For details, see Buying a CCE Standard/Turbo Cluster.
- The Volcano add-on of v1.11.14 or later has been installed. For details, see Volcano Scheduler.
- The Cloud Native Cluster Monitoring add-on (kube-prometheus-stack) has been installed and it runs in local data storage mode. For details, see Cloud Native Cluster Monitoring. If you use an on-premises Prometheus monitoring system, Prometheus 2.35.0 or later is recommended. For details, see Using Self-Built Prometheus to Configure Load-aware Scheduling.
- Use kubectl to access the cluster. For details, see Accessing a Cluster Using kubectl.
Features
The Kubernetes native scheduler schedules resources only based on requested resources. However, the actual resource usage of a pod differs greatly from the requested or limited value of the requested resources, which is the cause of cluster load imbalance.
- The actual resource usage of certain nodes in a cluster is far lower than the resource allocation rate, but no more pods are scheduled onto the nodes, leading to resource waste.
- The scheduler failed to detect that some nodes in the cluster are overloaded, which could significantly affect the stability of the service.
Volcano resolves the preceding issues based on actual loads. If there are plenty of resources, pods are preferentially scheduled to nodes with the lightest load to balance the load on each node in the cluster.
The status, workload traffic, and requests of a cluster change dynamically, and the resource usage of nodes changes in real time. To prevent extreme load imbalance in a cluster after pod scheduling, Volcano provides load-aware hotspot descheduling for the optimal load balancing of cluster nodes. For details about hotspot descheduling, see Descheduling.
How It Works
Load-aware scheduling is implemented using both Volcano and the CCE cloud native monitoring add-on (kube-prometheus-stack). After load-aware scheduling is enabled, metrics such as CPU and memory loads are defined by following Prometheus adapter rules. Then, the kube-prometheus-stack add-on collects and saves the actual CPU and memory loads of each node based on the defined metric rules. Volcano scores and sorts nodes based on the metric values provided by the kube-prometheus-stack add-on and preferentially schedules pods to the node with the lightest load.
Load-aware scheduling scores each node using the weighted average of the CPU and memory metrics as well as the load-aware scheduling policy and preferentially selects the node with the highest score for scheduling. You can create custom weights for the CPU, memory, and load-aware scheduling policy on the Scheduling tab by choosing Settings in the navigation pane of the target cluster.
The formula for scoring a node is as follows: Weight of the load-aware scheduling policy × [(1 - CPU usage) x CPU weight + (1 - Memory usage) × Memory weight]/(CPU weight + Memory weight)
- CPU usage: average CPU usage of all nodes in the target cluster in the last 10 minutes (The collection frequency can be modified in the Prometheus adapter rule.)
- Memory usage: average memory usage of all nodes in the target cluster in the last 10 minutes
Using Cloud Native Cluster Monitoring
- After installing the Cloud Native Cluster Monitoring add-on, you need to enable Metrics API to provide container resource metrics such as CPU usage and memory usage.Note
Resource metrics can be provided by Metrics API only when local data storage is enabled for the Cloud Native Cluster Monitoring add-on.
Check whether Metrics API has been enabled for the cluster. If it is enabled, you can skip this step.
kubectl get APIServices | grep v1beta1.metrics.k8s.ioIf any command output is displayed, Metrics API is enabled. Skip this step and go to the next step to add metric collection rules.
If no Metrics API is found, you can manually create an APIService object to enable it.
- Create a file named metrics-apiservice.yaml. Example file content:apiVersion: apiregistration.k8s.io/v1kind: APIServicemetadata:labels:app: custom-metrics-apiserverrelease: cceaddon-prometheusname: v1beta1.metrics.k8s.iospec:group: metrics.k8s.iogroupPriorityMinimum: 100insecureSkipTLSVerify: trueservice:name: custom-metrics-apiservernamespace: monitoringport: 443version: v1beta1versionPriority: 100
- Create an APIService object.kubectl create -f metrics-apiservice.yaml
- Check whether Metrics API is enabled for the cluster.kubectl get APIServices | grep v1beta1.metrics.k8s.ioNote
After Metrics API is enabled, if you need to uninstall the Cloud Native Cluster Monitoring add-on, run the following kubectl and delete the APIService object. Otherwise, the residual APIService resources will cause the Kubernetes Metrics Server add-on to fail to be installed.
kubectl delete APIService v1beta1.metrics.k8s.io
- Create a file named metrics-apiservice.yaml. Example file content:
- Add collection rules for custom metrics.
- Modify the user-adapter-config configuration item.kubectl edit configmap user-adapter-config -n monitoring
- Add collection rules to the rules field.
In the following example rules, the rules in red are new ones and those in black are existing ones:
...data:config.yaml: >rules:- seriesQuery: '{__name__=~"node_cpu_seconds_total"}'resources:overrides:instance:resource: nodename:matches: node_cpu_seconds_totalas: node_cpu_usage_avgmetricsQuery: avg_over_time((1 - avg (irate(<<.Series>>{mode="idle"}[5m])) by (instance))[10m:30s])- seriesQuery: '{__name__=~"node_memory_MemTotal_bytes"}'resources:overrides:instance:resource: nodename:matches: node_memory_MemTotal_bytesas: node_memory_usage_avgmetricsQuery: avg_over_time(((1-node_memory_MemAvailable_bytes/<<.Series>>))[10m:30s])resourceRules:cpu:containerQuery: sum(rate(container_cpu_usage_seconds_total{<<.LabelMatchers>>,container!="",pod!=""}[1m])) by (<<.GroupBy>>)nodeQuery: sum(rate(container_cpu_usage_seconds_total{<<.LabelMatchers>>, id='/'}[1m])) by (<<.GroupBy>>)resources:overrides:instance:resource: nodenamespace:resource: namespacepod:resource: podcontainerLabel: containermemory:containerQuery: sum(container_memory_working_set_bytes{<<.LabelMatchers>>,container!="",pod!=""}) by (<<.GroupBy>>)nodeQuery: sum(container_memory_working_set_bytes{<<.LabelMatchers>>,id='/'}) by (<<.GroupBy>>)resources:overrides:instance:resource: nodenamespace:resource: namespacepod:resource: podcontainerLabel: containerwindow: 1m...- Rules for collecting the average CPU usage
- node_cpu_usage_avg: average CPU usage of nodes. The name of this metric cannot be changed.
- metricsQuery: avg_over_time((1 - avg (irate(<<.Series>>{mode="idle"}[5m])) by (instance))[10m:30s]): statement for obtaining nodes' average CPU usage.
metricsQuery indicates to obtain the average CPU usage of all nodes in the target cluster in the last 10 minutes. To change the period, for example, to the last 5 or 30 minutes, change 10m in red to 5m or 30m.
- Rules for collecting the average memory usage
- node_memory_usage_avg: average memory usage of nodes. The name of this metric cannot be changed.
- metricsQuery: avg_over_time(((1-node_memory_MemAvailable_bytes/<<.Series>>))[10m:30s]): statement for obtaining nodes' average memory usage.
metricsQuery indicates to obtain the average memory usage of all nodes in the target cluster in the last 10 minutes. To change the period, for example, to the last 5 or 30 minutes, change 10m in red to 5m or 30m.
- Rules for collecting the average CPU usage
- Redeploy the custom-metrics-apiserver workload in the monitoring namespace.kubectl rollout restart deployment custom-metrics-apiserver -n monitoring
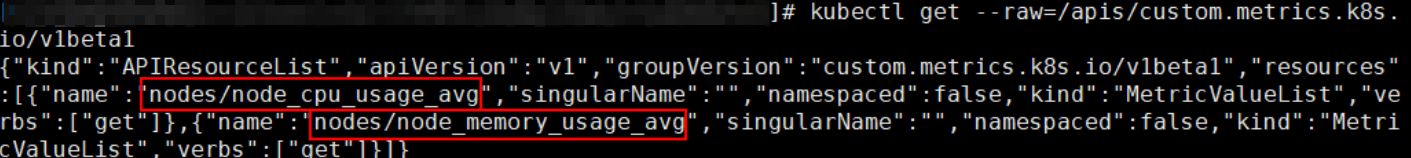
- Verify that the custom rules are configured successfully.
- Run the following command. If the custom metric information is returned, the metric collection configuration on Prometheus is successful.kubectl get --raw=/apis/custom.metrics.k8s.io/v1beta1

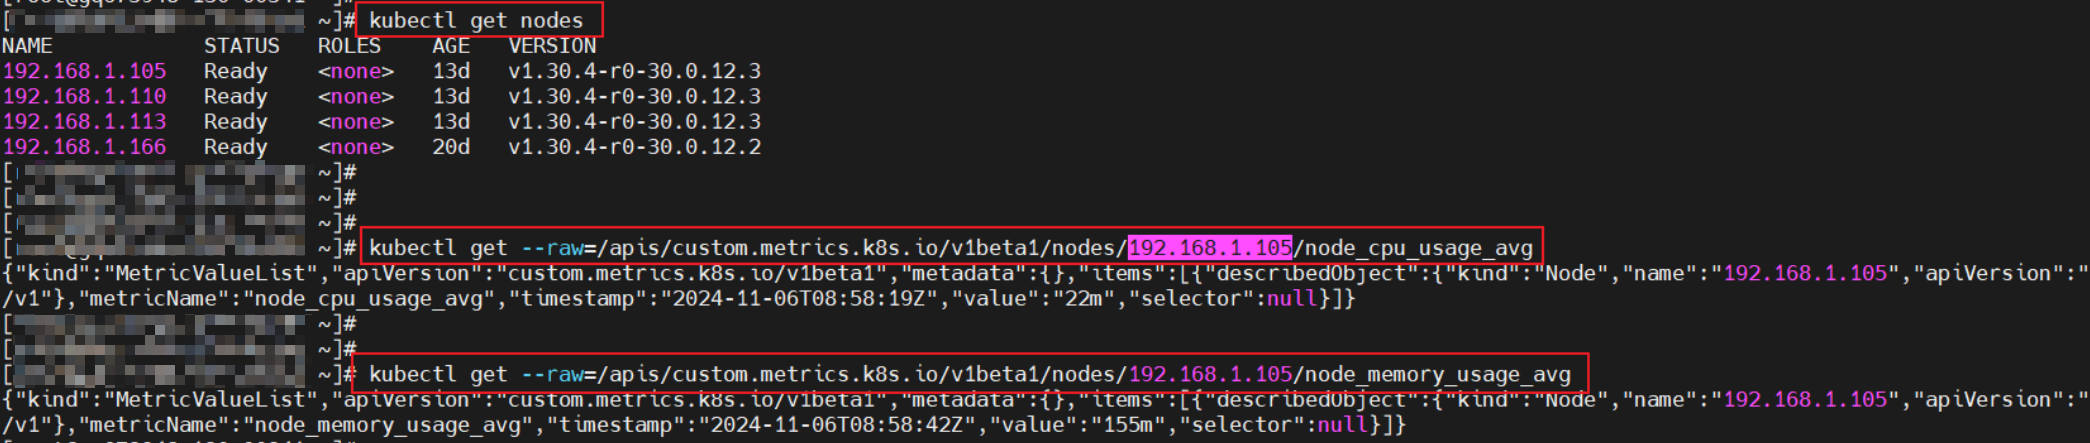
- Query information about nodes in the cluster.kubectl get nodes
Run the following command on any node. Replace xxxx with the obtained value of node_name. If you want to query the resource information of all nodes, replace xxxx with an asterisk (*).
kubectl get --raw=/apis/custom.metrics.k8s.io/v1beta1/nodes/xxxx/node_cpu_usage_avgInformation similar to the following is displayed.
- Run the following command. If the custom metric information is returned, the metric collection configuration on Prometheus is successful.
- Modify the user-adapter-config configuration item.
- Enable load-aware scheduling.
After Volcano is installed, you can enable or disable load-aware scheduling on the Scheduling page by choose Settings in the navigation pane. This function is disabled by default.
- Log in to the CCE console.
- Click the cluster name to access the cluster console. Choose Settings in the navigation pane. In the right pane, click the Scheduling tab.
- In the Resource utilization optimization scheduling area, modify the load-aware scheduling settings.Note
For optimal load-aware scheduling, disable bin packing because this policy preferentially schedules pods to the node with the maximal resources allocated based on pods' requested resources. This affects load-aware scheduling to some extent. For details about the combination of multiple policies, see Configuration Cases for Resource Usage-based Scheduling.
Parameter
Description
Default Value
Load-Aware Scheduling Policy Weight
A larger value indicates a higher weight of the load-aware policy in overall scheduling.
5
CPU Weight
A larger value indicates CPU resources will be preferentially balanced.
1
Memory Weight
A larger value indicates memory resources will be preferentially balanced.
1
Actual load threshold effective mode
- Soft constraint: When the actual CPU or memory load of a node reaches the threshold, new tasks will be preferentially allocated to underutilized nodes, but this node can still be scheduled.
- Hard constraint: When the actual CPU or memory load of a node reaches the threshold, no new tasks can be scheduled to this node.
Hard constraint
Actual CPU Load Threshold
When a node's CPU usage goes beyond this threshold, workloads will be scheduled based on how the load threshold takes effect. New workloads will be preferentially or forcibly scheduled to other nodes. Existing workloads on the nodes are not affected.
80
Actual Memory Load Threshold
When a node's memory usage goes beyond this threshold, workloads will be scheduled based on how the load threshold takes effect. New workloads will be preferentially or forcibly scheduled to other nodes. Existing workloads on the nodes are not affected.
80
Using Self-Built Prometheus to Configure Load-aware Scheduling
- Install prometheus-adapter in the cluster.
- Run the following commands to install prometheus-adapter:git clone https://github.com/kubernetes-sigs/prometheus-adapter.gitcd prometheus-adapter/deploy/manifestskubectl apply -f .
- Modify the configuration for prometheus-adapter to connect to prometheus-server.kubectl edit deployment prometheus-adapter -n monitoring
Change the value of prometheus-url as follows:
- Change HTTPS to HTTP.
- Change the default domain name to the IP address and port of Prometheus Service. You can run the kubectl get service -n monitoring command to query the IP address and port.
...containers:- name: prometheus-adapterimage: registry.k8s.io/prometheus-adapter/prometheus-adapter:v0.12.0args:- --cert-dir=/var/run/serving-cert- --config=/etc/adapter/config.yaml- --prometheus-url=http://10.21.72.124:9090/- --secure-port=6443- --tls-cipher-suites=TLS_ECDHE_RSA_WITH_CHACHA20_POLY1305,TLS_ECDHE_ECDSA_WITH_CHACHA20_POLY1305,TLS_ECDHE_RSA_WITH_AES_128_GCM_SHA256,TLS_ECDHE_RSA_WITH_AES_256_GCM_SHA384,TLS_ECDHE_ECDSA_WITH_AES_128_GCM_SHA256,TLS_ECDHE_ECDSA_WITH_AES_256_GCM_SHA384,TLS_ECDHE_RSA_WITH_AES_128_CBC_SHA,TLS_ECDHE_ECDSA_WITH_AES_128_CBC_SHA256,TLS_ECDHE_ECDSA_WITH_AES_128_CBC_SHA,TLS_ECDHE_RSA_WITH_AES_256_CBC_SHA,TLS_ECDHE_ECDSA_WITH_AES_256_CBC_SHA,TLS_RSA_WITH_AES_128_GCM_SHA256,TLS_RSA_WITH_AES_256_GCM_SHA384,TLS_RSA_WITH_AES_128_CBC_SHA,TLS_RSA_WITH_AES_256_CBC_SHA... - Verify that the native node_cpu_seconds_total and node_memory_MemAvailable_bytes metrics can be obtained on Prometheus.
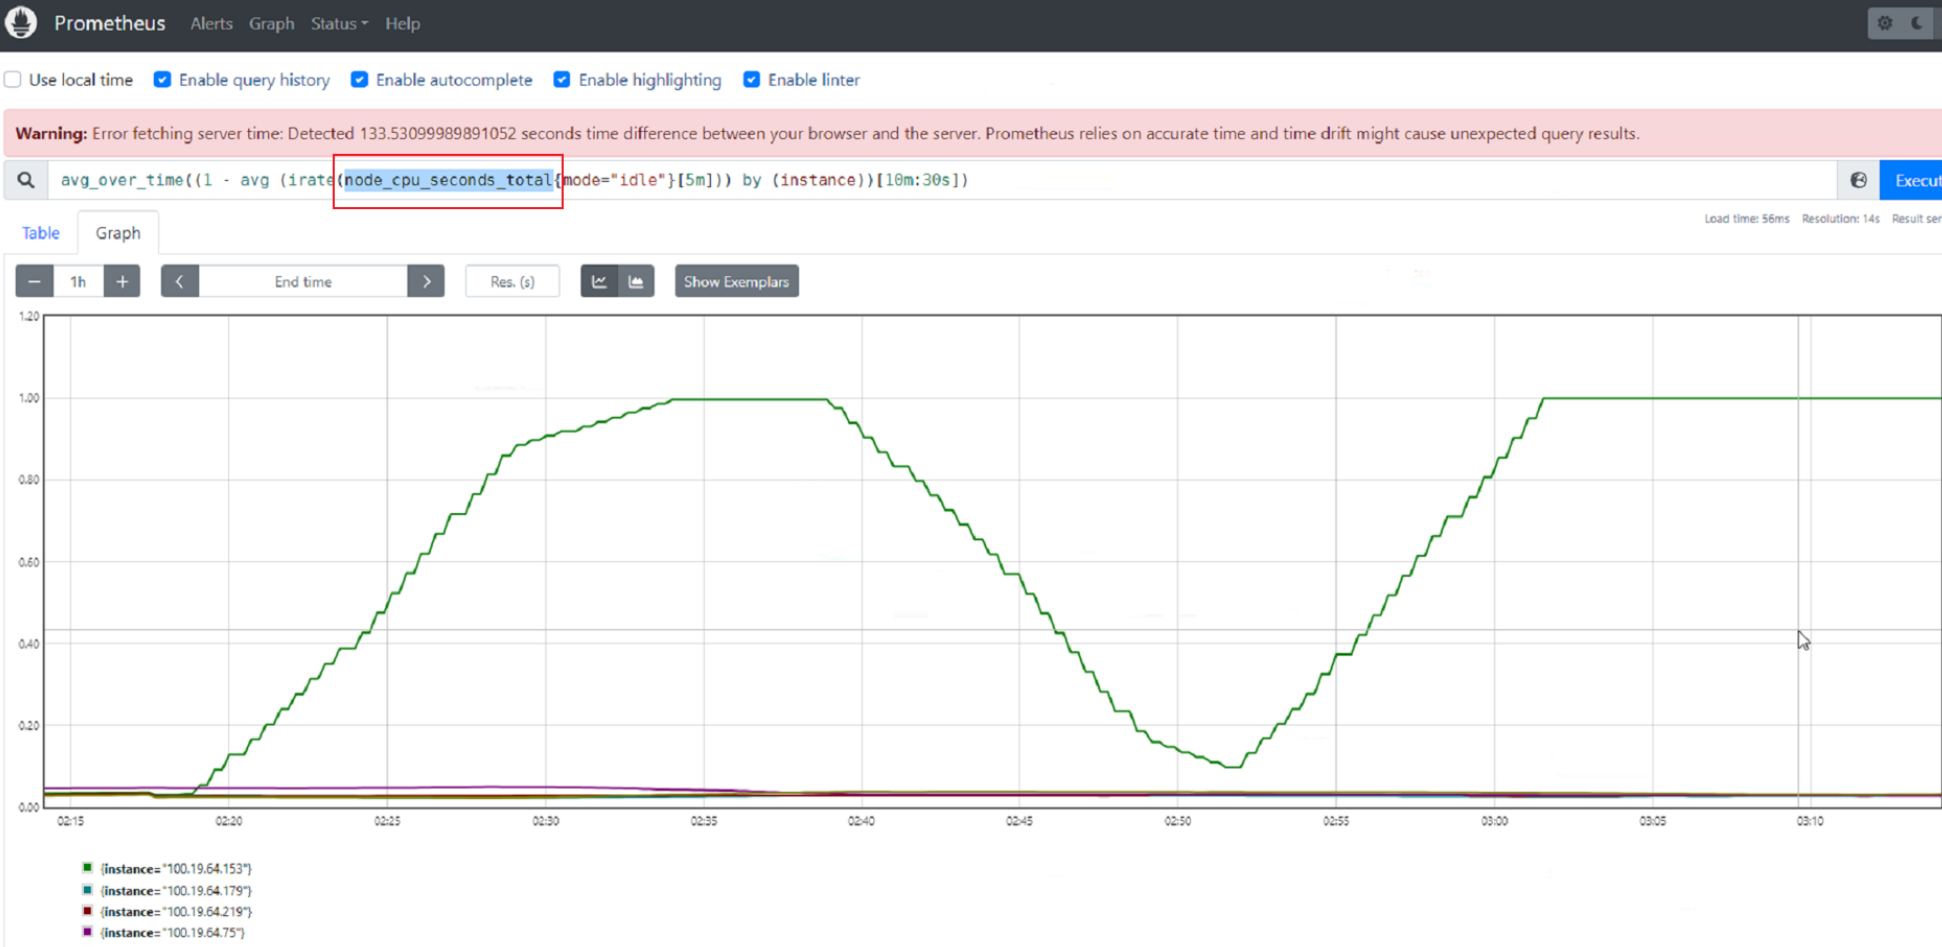
- Run the following commands to install prometheus-adapter:
- Enable Custom Metrics API to provide container resource metrics.
Check whether Custom Metrics API has been enabled for the cluster. If it is enabled, you can skip this step.
kubectl get APIServices | grep v1beta1.custom.metrics.k8s.ioIf any command output is displayed, Custom Metrics API has been enabled. If no command output is displayed, perform the following operations to register the APIService object. (Note that the Service name and namespace must be consistent with those in the actual installation environment.) The following uses the default values of kube-prometheus.
- Create a file named custom-metrics-apiservice.yaml. Example file content:apiVersion: apiregistration.k8s.io/v1kind: APIServicemetadata:labels:app.kubernetes.io/component: metricsapp.kubernetes.io/name: prometheus-adapterapp.kubernetes.io/part-of: prometheus-adaptername: v1beta1.custom.metrics.k8s.iospec:group: custom.metrics.k8s.iogroupPriorityMinimum: 100insecureSkipTLSVerify: trueservice:name: prometheus-adapternamespace: monitoringport: 443version: v1beta1versionPriority: 100
- Create an APIService object.kubectl create -f custom-metrics-apiservice.yaml
- Check whether Custom Metrics API is enabled for the cluster.kubectl get APIServices | grep v1beta1.custom.metrics.k8s.io
- Create a file named custom-metrics-apiservice.yaml. Example file content:
- Add collection rules for custom metrics.
- Modify the adapter-config configuration item.kubectl edit configmap adapter-config -n monitoring
- Add collection rules to the rules field.
Example collection rules:
...data:config.yaml: >rules:- seriesQuery: '{__name__=~"node_cpu_seconds_total"}'resources:overrides:instance:resource: nodename:matches: node_cpu_seconds_totalas: node_cpu_usage_avgmetricsQuery: avg_over_time((1 - avg (irate(<<.Series>>{mode="idle"}[5m])) by (instance))[10m:30s])- seriesQuery: '{__name__=~"node_memory_MemTotal_bytes"}'resources:overrides:instance:resource: nodename:matches: node_memory_MemTotal_bytesas: node_memory_usage_avgmetricsQuery: avg_over_time(((1-node_memory_MemAvailable_bytes/<<.Series>>))[10m:30s])... - Redeploy the prometheus-adapter workload in the monitoring namespace.kubectl rollout restart deployment prometheus-adapter -n monitoring
- Verify that the custom rules are configured successfully.
- Run the following command. If the custom metric information is returned, the metric collection configuration on Prometheus is successful.kubectl get --raw=/apis/custom.metrics.k8s.io/v1beta1
- Query information about nodes in the cluster.kubectl get nodes
Run the following command on any node. Replace xxxx with the obtained value of node_name. If you want to query the resource information of all nodes, replace xxxx with an asterisk (*).
kubectl get --raw=/apis/custom.metrics.k8s.io/v1beta1/nodes/xxxx/node_cpu_usage_avgInformation similar to the following is displayed.

- Run the following command. If the custom metric information is returned, the metric collection configuration on Prometheus is successful.
- Modify the adapter-config configuration item.
- Enable load-aware scheduling.
After Volcano is installed, you can enable or disable load-aware scheduling on the Scheduling page by choose Settings in the navigation pane. This function is disabled by default.
- Log in to the CCE console.
- Click the cluster name to access the cluster console. Choose Settings in the navigation pane. In the right pane, click the Scheduling tab.
- In the Resource utilization optimization scheduling area, modify the load-aware scheduling settings.Note
For optimal load-aware scheduling, disable bin packing because this policy preferentially schedules pods to the node with the maximal resources allocated based on pods' requested resources. This affects load-aware scheduling to some extent. For details about the combination of multiple policies, see Configuration Cases for Resource Usage-based Scheduling.
Parameter
Description
Default Value
Load-Aware Scheduling Policy Weight
A larger value indicates a higher weight of the load-aware policy in overall scheduling.
5
CPU Weight
A larger value indicates CPU resources will be preferentially balanced.
1
Memory Weight
A larger value indicates memory resources will be preferentially balanced.
1
Actual load threshold effective mode
- Soft constraint: When the actual CPU or memory load of a node reaches the threshold, new tasks will be preferentially allocated to underutilized nodes, but this node can still be scheduled.
- Hard constraint: When the actual CPU or memory load of a node reaches the threshold, no new tasks can be scheduled to this node.
Hard constraint
Actual CPU Load Threshold
When a node's CPU usage goes beyond this threshold, workloads will be scheduled based on how the load threshold takes effect. New workloads will be preferentially or forcibly scheduled to other nodes. Existing workloads on the nodes are not affected.
80
Actual Memory Load Threshold
When a node's memory usage goes beyond this threshold, workloads will be scheduled based on how the load threshold takes effect. New workloads will be preferentially or forcibly scheduled to other nodes. Existing workloads on the nodes are not affected.
80
- Prerequisites
- Features
- How It Works
- Using Cloud Native Cluster Monitoring
- Using Self-Built Prometheus to Configure Load-aware Scheduling