Modifying GUC Parameters of the GaussDB(DWS) Cluster
After a cluster is created, you can modify the cluster's database parameters as required. On the GaussDB(DWS) console, you can configure common database parameters. For details, see Modifying Parameters. You can also view the parameter modification history. For details, see Viewing Parameter Change History. Click Export to export all parameter settings of the cluster. You can run SQL commands to view or set other database parameters. For details, see in the Data Warehouse Service (DWS) Developer Guide.
Prerequisites
You can modify parameters only when no task is running in the cluster.
Modifying Parameters
- Log in to the GaussDB(DWS) console.
- Choose Dedicated Clusters > Clusters in the navigation pane.
- In the cluster list, find the target cluster and click the cluster name. The Cluster Information page is displayed.
- Click the Parameters tab and modify the parameter values. Then click Save.
To modify parameters based on filter criteria, click the drop-down list above the parameter list and search for the desired parameters. The filter criteria include Common Configuration, Function Control Configuration, Cluster Memory Configuration, Cluster Disk Configuration, Cluster Network Configuration, SQL Tuning Configuration, SQL Compatibility Configuration, and All Configurations. If you choose Common Configuration, you will see the first 20 frequently modified parameters in the region where the cluster is located. If there are no statistics available, you can use a customized configuration. Select All Configurations to view all parameters. Set the parameters based on Function Control Parameters.
Click the search box to search for a parameter based on the parameter name and whether to restart the cluster.
- In the Modification Preview dialog box, confirm the modifications and click Save.
- You can determine whether you need to restart the cluster after parameter modification based on the Restart Cluster column.Note
- If cluster restart is not required for a parameter, the parameter modification takes effect immediately.
- If cluster restart is required for parameter modifications to take effect, the new parameter values will be displayed on the page after the modification, but will not take effect until the cluster is restarted. Before a restart, the cluster status is To be restarted, and some O&M operations are disabled.
Viewing Parameter Change History
Perform the following steps to view the parameter modification history and check whether the modifications have taken effect:
Procedure
- Log in to the GaussDB(DWS) console.
- Choose Dedicated Clusters > Clusters in the navigation pane.
- In the cluster list, find the target cluster and click the cluster name. The Cluster Information page is displayed.
- Click the Modify Records tab.Note
- If a parameter can take effect immediately after modification, its status will change to Synchronized after you modify it.
- If a parameter can take effect only after a cluster restart, its status will change to To be restarted after you modify it. You can click the expansion icon on the left to view the parameters that have not taken effect. After the cluster is restarted, the status of the record will change to Synchronized.
- By default, only the change history within a specified period is displayed. To check the entire change history of a parameter, search for it in the search box in the upper right corner.
Exporting the Parameter List
- Log in to the GaussDB(DWS) console.
- Choose Dedicated Clusters > Clusters in the navigation pane.
- In the cluster list, find the target cluster and click the cluster name. The Cluster Information page is displayed.
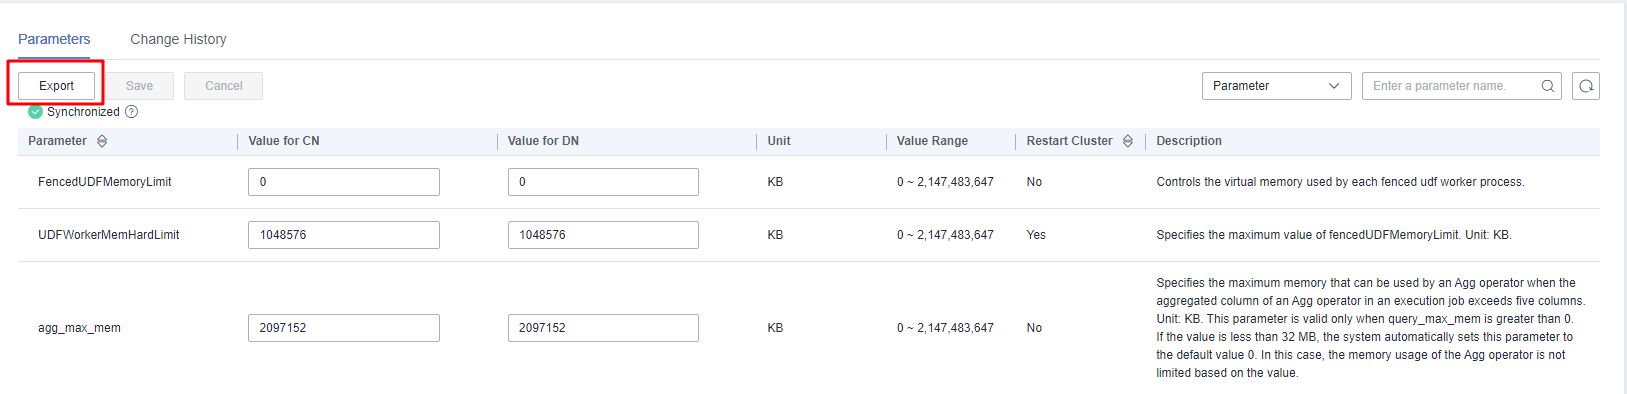
- Click Parameters and click Export. You can export cluster configuration parameters.
Figure 1 Exporting parameter settings
Function Control Parameters
Parameter | Description | Value Range |
|---|---|---|
audit_enabled | Whether to enable or disable the audit process. After the audit process is enabled, it can read the auditing information written by the background process from the pipe and save it into audit files. | on or off |
audit_space_limit | Maximum storage space occupied by audit files Unit: KB | 1,024–1,073,741,824 |
autoanalyze | Whether to allow automatic statistics collection for a table that has no statistics or a table whose amount of data modification reaches the threshold for triggering ANALYZE when a plan is generated. In this case, AUTOANALYZE cannot be triggered for foreign tables or temporary tables with the ON COMMIT [DELETE ROWS|DROP] option. To collect statistics, you need to manually perform the ANALYZE operation. If an exception occurs in the database during the execution of AUTOANALYZE on a table, after the database is recovered, the system may still prompt you to collect the statistics of the table when you run the statement again. In this case, manually perform ANALYZE on the table to synchronize statistics. | on or off |
autovacuum_max_workers | Maximum number of concurrent autovacuum threads. 0 indicates that autovacuum is disabled. | 0–128 |
autovacuum_max_workers_hstore | Number of automerge threads in the hstore table. The value cannot be greater than the value of autovacuum_max_workers. To modify this parameter, add the value of autovacuum_max_workers_hstore to the original value of autovacuum_max_workers. | 0–128 |
autovacuum_naptime | Interval between two autovacuum operations, in seconds. | 1–2,147,483 |
autovacuum_vacuum_cost_delay | Value of the cost delay used in the autovacuum operation. | –1–100 |
behavior_compat_options | Configuration items for database compatibility. Multiple items are separated by commas (,). strict_concat_functions and strict_text_concat_td are mutually exclusive. | - |
checkpoint_segments | Minimum number of WAL segment files retained in a period. The size of each log file is 16 MB. | 1–2,147,483,646 |
ddl_lock_timeout | Number of seconds a DDL command should wait for the locks to become available. If the time spent in waiting for a lock exceeds the specified time, an error is reported. | 0–2,147,483,647 |
enable_resource_record | Whether to enable resource recording. | on or off |
enable_resource_track | Whether to enable resource monitoring. | on or off |
enable_track_record_subsql | Whether to enable the function of recording and archiving sub-statements. When this function is enabled, sub-statements in stored procedures and anonymous blocks are recorded and archived to the corresponding INFO table (GS_WLM_SESSION_INFO). This parameter is specific to a session and can be set and applied within the session connected to the CN. Only the statements executed within that session will be affected. It can also be configured on both the CN and DN and take effect globally. | on or off |
enable_user_metric_persistent | Whether to dump the historical monitoring data of user resources. If this parameter is set to on, data in the PG_TOTAL_USER_RESOURCE_INFO view is periodically sampled and saved to the system catalog PG_WLM_USER_RESOURCE_HISTORY. | on or off |
enable_view_update | Whether to enable the view update function. | on or off |
extra_float_digits | Number of digits displayed for floating-point values, including float4, float8, and geometric data types. The parameter value is added to the standard number of digits (FLT_DIG or DBL_DIG as appropriate). | –15–3 |
failed_login_attempts | Number of consecutive incorrect password attempts after which the account is locked. 0 indicates that the number of incorrect password attempts is not limited. | 0–1,000 |
instr_unique_sql_count | Whether to collect unique SQL statements and how many statements can be collected. | 0–2,147,483,647 |
job_queue_processes | Number of jobs that can be concurrently executed. This parameter is a postmaster parameter. You can set it using gs_guc, and you need to restart gaussdb to make the setting take effect. | 0–1,000 |
lockwait_timeout | Maximum wait time for a single lock, in milliseconds. If the lock wait time exceeds the value, the system will report an error. | 0–2,147,483,647 |
max_active_statements | Maximum number of concurrent jobs. This parameter applies to all the jobs on one CN. –1 and 0 indicate that the number of concurrent jobs is not limited. | –1–2,147,483,647 |
max_files_per_node | Maximum number of files that can be opened by a single SQL statement on a single node. | –1–2,147,483,647 |
max_prepared_transactions | Maximum number of transactions that can stay in the prepared state simultaneously. If the value of this parameter is increased, GaussDB(DWS) requires more System V shared memory than the default system setting. | 0–536,870,911 |
max_process_memory_auto_adjust | Whether to enable automatic modification for the max_process_memory parameter. | on or off |
object_mtime_record_mode | Update action of the mtime column in the PG_OBJECT system catalog.
| - |
plog_merge_age | Output interval of performance log data. | 0–2,147,483,647 |
random_function_version | Random function version selected by ANALYZE during data sampling. | 0–1 |
resource_track_cost | Minimum execution cost for resource monitoring on statements. –1 indicates that resource monitoring is disabled. If the value is greater than or equal to 0, and the cost of executing statements exceeds the value and is greater than or equal to 10, resource monitoring is performed. | –1–2,147,483,647 |
resource_track_duration | Minimum time for archiving executed statements recorded during real-time monitoring, in seconds. 0 indicates that all the statements are archived. If the value is greater than 0, historical information about statements whose execution time exceeds the specified value is archived. | 0–2,147,483,647 |
resource_track_level | Resource monitoring level of the current session. This parameter is valid only when enable_resource_track is set to on.
| - |
security_enable_options | Operations that can be unprohibited in security mode.
| - |
session_timeout | Timeout interval of an idle session, in seconds. 0 indicates that the timeout limit is disabled. | 0–86,400 |
space_once_adjust_num | Threshold of the number of files processed each time in slow build and fine-grained calibration in space management and space statistics. 0 indicates that the slow build and fine-grained calibration functions are disabled. The number of files in the database can impact its resources. You are advised to set this parameter to a proper value. NOTE: This parameter is supported only by clusters of version 8.1.3 or later. | 0–2,147,483,647 |
statement_timeout | Statement timeout interval, in milliseconds. When the execution time of a statement exceeds the value (starting from the time when the server receives the command), the statement reports an error and exits. | 0–2,147,483,647 |
timezone | Time zone for displaying and interpreting time stamps. | - |
topsql_retention_time | Data storage retention period of the gs_wlm_session_info and gs_wlm_operator_info catalogs in historical top SQL statements, in days. Before setting this GUC parameter to enable the data storage function, clear data in the gs_wlm_session_info and gs_wlm_operator_info tables.
| 0–3,650 |
user_metric_retention_time | Retention time of the user historical resource monitoring data. This parameter is valid only when enable_user_metric_persistent is set to on. | 0–3,650 |
view_independent | Whether to decouple views from tables, functions, and synonyms. After the base table is restored, automatic association and re-creation are supported. | on or off |
wlm_memory_feedback_adjust | Whether to enable memory negative feedback for dynamic load management. The available options include:
| on or off |
Cluster Memory Configuration Parameters
Parameter | Description | Value Range |
|---|---|---|
comm_usable_memory | Maximum memory available for buffering on the TCP proxy communication library or SCTP communication library on a single DN. The unit is KB. | 102,400–1,073,741,823 |
cstore_buffers | Size of the shared buffer used by column-store tables and column-store tables (ORC, Parquet, and CarbonData) of OBS and HDFS foreign tables. The unit is KB. | 16,384–1,073,741,823 |
maintenance_work_mem | Maximum size of memory used for maintenance operations, involving VACUUM, CREATE INDEX, and ALTER TABLE ADD FOREIGN KEY. This parameter may affect the execution efficiency of VACUUM, VACUUM FULL, CLUSTER, and CREATE INDEX. | 1,024–2,147,483,647 |
max_process_memory | Maximum physical memory available for a database node. The unit is KB. The default value is calculated by multiplying the physical memory by 0.8 and dividing it by the sum of 1 and the maximum number of primary DNs in the cluster. | 2,097,152–2,147,483,647 |
query_max_mem | Maximum memory that can be used by a query. If the value of query_max_mem is greater than 0, an error will be reported if the query's memory usage exceeds that value. | 0–2,147,483,647 |
session_history_memory | Memory size of historical query views, in KB. | 10,240–2,147,483,647 |
shared_buffers | Size of the shared memory used by GaussDB(DWS). If the value of this parameter is increased, GaussDB(DWS) requires more System V shared memory than the default system setting. The unit is 8 KB. | 16–1,073,741,823 |
udf_memory_limit | Maximum physical memory that can be used when UDFs are executed on each CN and DN, in KB. | 204,800–2,147,483,647 |
work_mem | Size of the memory used by internal sequential operations and the Hash table before data is written into temporary disk files. Sort operations are required for ORDER BY, DISTINCT, and merge joins. Hash tables are used in hash joins, hash-based aggregation, and hash-based processing of IN subqueries. In a complex query, several sort or hash operations may run in parallel; each operation will be allowed to use as much memory as this parameter specifies. If the memory is insufficient, data will be written into temporary files. In addition, several running sessions could be performing such operations concurrently. Therefore, the total memory used may be many times the value of work_mem. | 64–2,147,483,647 |
Cluster Disk Configuration Parameters
Parameter | Description | Value Range |
|---|---|---|
sql_use_spacelimit | Specifies the space size for files to be flushed to disks when a single SQL statement is executed on a single DN, in KB. The managed space includes the space occupied by ordinary tables, temporary tables, and intermediate result sets to be flushed to disks. –1 indicates no limit. | –1–2,147,483,647 |
temp_file_limit | Size of a single file spilled to disk if splitting is triggered in a session. The temporary file can be a sort or hash temporary file, or the storage file for a held cursor. | –1–2,147,483,647 |
Cluster Network Configuration Parameters
Parameter | Description | Value Range |
|---|---|---|
comm_max_stream | Maximum number of concurrent data streams supported by the TCP proxy communication library or SCTP communication library. The value of this parameter must be greater than the number of concurrent operators multiplied by the average number of stream operators per concurrent operator multiplied by the square of smp. | 1–65,535 |
max_connections | Maximum number of allowed concurrent connections to the database. This parameter affects the concurrent processing capability of the cluster. | 100–262,143 |
max_pool_size | Maximum number of connections between the CN connection pool and another CN/DN. | 1–65,535 |
SQL Tuning Parameters
Parameter | Description | Value Range |
|---|---|---|
agg_redistribute_enhancement | When the aggregate operation is performed, which contains multiple group by columns and none of them is the distribution key, a group by column will be selected for redistribution. This parameter specifies the policy of selecting a redistribution column. | on or off |
best_agg_plan | Type of hashagg plan generated by the optimizer. | 0–3 |
cost_model_version | Model used for cost estimation in the application scenario. This parameter affects the distinct estimation of the expression, HashJoin cost model, estimation of the number of rows, distribution key selection during redistribution, and estimation of the number of aggregate rows. | 0–4 |
default_statistics_target | Default analysis ratio. | –100–10,000 |
enable_codegen | Whether to enable code optimization. Currently, LLVM optimization is used. The availability options are on and off. You can choose on to enable code optimization. | - |
enable_extrapolation_stats | Whether the extrapolation logic is used for data of date type based on historical statistics. The logic can increase the accuracy of estimation for tables whose statistics are not collected in time, but will possibly provide an overlarge estimation due to incorrect extrapolation. Enable the logic only in scenarios where the data of date type is periodically inserted. | on or off |
hashjoin_spill_strategy | Select a hash join policy.
| 0–6 |
max_streams_per_query | Number of Stream nodes in a query plan. | –1–10,000 |
qrw_inlist2join_optmode | Whether to enable inlist-to-join query rewrite.
| - |
query_dop | User-defined symmetric multi-processing (SMP) degree. [1, 64]: Fixed SMP is enabled, and the system will use the specified degree. [–64, –1]: SMP adaptation is enabled, and the system will dynamically select a degree from the limited range. | –64–64 |
rewrite_rule | Rewriting rule for enabled optional queries. Some query rewriting rules are optional. Enabling them cannot always improve query efficiency. In certain scenarios, you can set the query rewriting rules through this parameter to achieve optimal query efficiency.
| - |
SQL Compatibility Parameters
Parameter | Description | Value Range |
|---|---|---|
full_group_by_mode | Behavior after enabling disable_full_group_by_mysql:
| - |
- Prerequisites
- Modifying Parameters
- Viewing Parameter Change History
- Exporting the Parameter List
- Function Control Parameters
- Cluster Memory Configuration Parameters
- Cluster Disk Configuration Parameters
- Cluster Network Configuration Parameters
- SQL Tuning Parameters
- SQL Compatibility Parameters