Function
This section describes how to check cluster metrics on Cloud Eye. By monitoring cluster running metrics, you can identify the time when the database cluster is abnormal and analyze potential activity problems based on the database logs, improving database performance. This section describes the metrics that can be monitored by Cloud Eye as well as their namespaces and dimensions. You can use the management console or APIs provided by Cloud Eye to query the monitoring metrics and alarms generated by DWS. For details, see the User Guide and API Reference of Cloud Eye.
Namespace
SYS.DWS
Cluster Monitoring Metrics
With the DWS monitoring metrics provided by Cloud Eye, you can obtain information about the cluster running status and performance. This information will provide a better understanding of the node-level information.
Table 1 describes DWS monitoring metrics.
Metric ID | Name | Description | Value Range | Unit | Conversion Rule | Dimension | Monitoring Period (Raw Data) |
|---|---|---|---|---|---|---|---|
dws001_shared_buffer_hit_ratio | Cache Hit Ratio | Ratio of requested data that already exists in the cache. It is the ratio of the amount of data that already exists in the cache to the total amount of requested data. A higher cache hit ratio means higher cache usage of the system, fewer times that data needs to be read from the disk or network, and faster system response speed. | 0% to 100% | % | N/A | datastore_id | 4 minutes |
dws002_in_memory_sort_ratio | In-memory Sort Ratio | Ratio of the extra memory space used by the sorting algorithm to the memory space occupied by the sorted data. In a merge sort, for example, the size of the merge buffer is often proportional to the size of the sorted data, so the in-memory ratio is usually between 10% and 50%. | 0% to 100% | % | N/A | datastore_id | 4 minutes |
dws003_physical_reads | File Reads | Total number of database file reads. | > 0 | count | N/A | datastore_id | 4 minutes |
dws004_physical_writes | File Writes | Total number of database file writes. | > 0 | count | N/A | datastore_id | 4 minutes |
dws005_physical_reads_per_second | File Reads per Second | Number of database file reads per second. | ≥ 0 | count/s | N/A | datastore_id | 4 minutes |
dws006_physical_writes_per_second | File Writes per Second | Number of database file writes per second. | ≥ 0 | count/s | N/A | datastore_id | 4 minutes |
dws007_db_size | Data Volume | Total data volume in the database. | ≥ 0 MB | MB | 1024(IEC) | datastore_id | 4 minutes |
dws008_active_sql_count | Active SQL Count | Number of active SQLs in the database. | ≥ 0 | count | N/A | datastore_id | 4 minutes |
dws009_session_count | Session Count | Number of current connections to the database. | ≥ 0 | count | N/A | datastore_id | 4 minutes |
dws010_cpu_usage | CPU Usage | CPU usage of each node in the cluster. | 0% to 100% | % | N/A | dws_instance_id | 1 minute |
dws011_mem_usage | Memory Usage | Memory usage of each node in the cluster. NOTE: After the console is upgraded to 8.3.0.202, the memory usage includes the memory occupied by the cache. Therefore, the value of this metric increases compared with that before the upgrade. | 0% to 100% | % | N/A | dws_instance_id | 1 minute |
dws012_iops | IOPS | Number of I/O requests processed by each node in the cluster per second. | ≥ 0 | count/s | N/A | dws_instance_id | 1 minute |
dws013_bytes_in | Network Input Throughput | Total amount of data input to each node in the cluster per second. | ≥ 0 bytes/s | byte/s | 1024(IEC) | dws_instance_id | 1 minute |
dws014_bytes_out | Network Output Throughput | Data sent to the network per second from each node in the cluster. | ≥ 0 bytes/s | byte/s | 1024(IEC) | dws_instance_id | 1 minute |
dws015_disk_usage | Disk Usage | Disk usage of each node in a cluster. | 0% to 100% | % | N/A | dws_instance_id | 1 minute |
dws016_disk_total_size | Total Disk Size | Total data disk size of each node in the cluster. | 100 to 2,000 GB | GB | 1024(IEC) | dws_instance_id | 1 minute |
dws017_disk_used_size | Used Disk Space | Used data disk space of each node in the cluster. | 0 to 3,600 GB | GB | 1024(IEC) | dws_instance_id | 1 minute |
dws018_disk_read_throughput | Disk Read Throughput | Amount of data read from the data disk per second by each node in the cluster. | ≥ 0 bytes/s | byte/s | 1024(IEC) | dws_instance_id | 1 minute |
dws019_disk_write_throughput | Disk Write Throughput | Amount of data written to the data disk per second by each node in the cluster. | ≥ 0 bytes/s | byte/s | 1024(IEC) | dws_instance_id | 1 minute |
dws020_avg_disk_sec_per_read | Average Time per Disk Read | Average time a disk takes to read data. | > 0s | Second | N/A | dws_instance_id | 1 minute |
dws021_avg_disk_sec_per_write | Average Time per Disk Write | The average time it takes to write data to a disk in a cluster. | > 0s | Second | N/A | dws_instance_id | 1 minute |
dws022_avg_disk_queue_length | Average Disk Queue Length | Average disk I/O queue length of each node in a cluster. | ≥ 0 | count | N/A | dws_instance_id | 1 minute |
Dimensions
Key | Value |
|---|---|
datastore_id | Data warehouse cluster ID, which can be obtained from Table 1. |
dws_instance_id | Data warehouse node ID, which can be obtained from Managing Nodes. |
Cluster and Node Monitoring Information
- Log in to the DWS console.
- In the navigation pane on the left, choose Cluster > Cluster List.
- View the cluster information. In the cluster list, locate your desired cluster, click More in its Operation column, and select View Metric. The Cloud Eye management console is displayed. By default, the cluster monitoring information on the Cloud Eye management console is displayed.
Additionally, you can specify a specific monitoring metric and the time range to view the performance curve.
NoteThe positions of the function keys in the Operation column are dynamic. To ensure that there are always two function keys visible before More, any function keys that typically appear only when you hover over More will be moved to a position directly before More. This adjustment occurs if there are some functions whose keys are supposed to be placed before More but are not supported for the current site.
Comparing the Monitoring Metrics of Multiple Nodes
- In the navigation pane of the Cloud Eye management console, choose Dashboards > My Dashboards. Click the name of the dashboard for which you want to add a graph. On the My Dashboards page that is displayed, click Add Graph.
- On the Add Graph page, you can select Line Chart or Bar Chart to display the graph. After confirming that the information is correct, click OK.
For example, select Line Chart and One View for Multiple Metrics to compare the CPU usage of three DWS nodes. The following table describes the parameters.
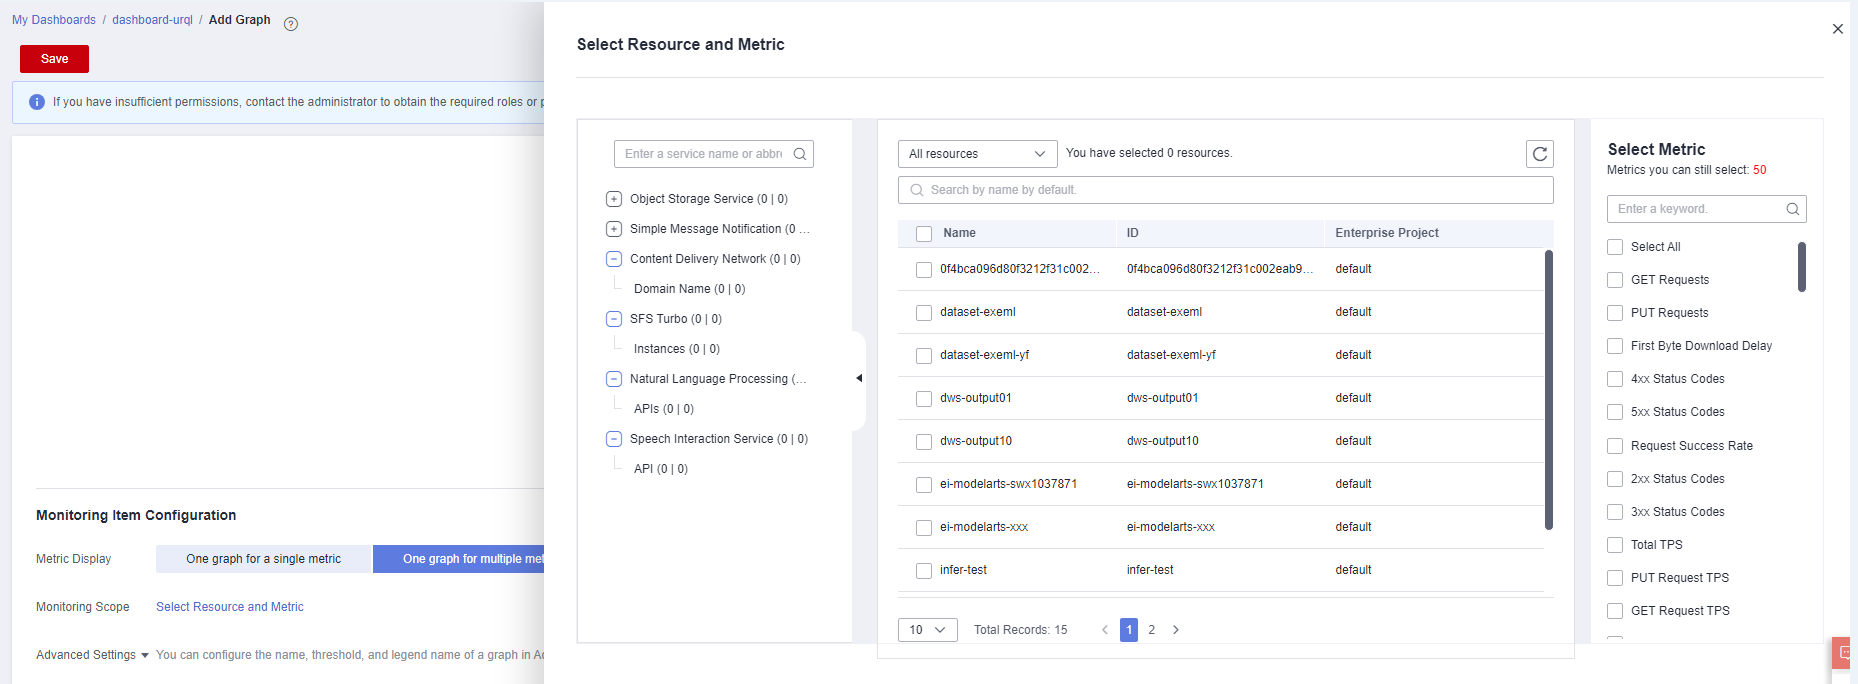
Table 2 Configuration example Parameter
Example Value
Resource Type
DWS
Dimension
Data Warehouse Node
Monitored Object
dws-demo-dws-cn-cn-2-1
dws-demo-dws-cn-cn-1-1
dws-demo-dws-dn-1-1
Metric
CPU Usage
- Click OK.
On the selected My Dashboards page, you can view the metric trend on the newly added monitoring graph. You can click the zoom in icon to zoom in and view detailed metric comparison data.
Creating Alarm Rules
Setting DWS alarm rules allows you to customize the monitored objects and notification policies and determine the running status of your DWS at any time.
The DWS alarm rules include alarm rule name, instance, metric, threshold, monitoring interval and whether to send notification. This section describes how to set DWS alarm rules.
- Log in to the DWS console.
- In the navigation pane on the left, choose Cluster > Cluster List.
- Locate the row containing the target cluster, click View Metric in the Operation column to enter the Cloud Eye management console and view the DWS monitoring information.
The status of the target cluster must be Available. Otherwise, you cannot create alarm rules.
- In the left navigation pane of the Cloud Eye management console, choose Alarm Management > Alarm Rules.
- On the Alarm Rules page, click Create Alarm Rule in the upper right corner.
- On the Create Alarm Rule page, set parameters as prompted.
- Configure the rule name and description.
- Configure the alarm parameters as prompted.
Table 3 Configuring alarm parameters Parameter
Description
Resource Type
Name of the cloud service resource for which the alarm rule is configured.
Dimension
Metric dimension of the alarm rule. You can select Data Warehouse Nodes or Data Warehouses.
Monitoring Scope
Resource scope the alarm rule applies to. Select Specified resources and select one or more monitored objects. For DWS, select the cluster ID or node ID in the dialog box that is displayed.
Trigger Rule
You can select an associated template, use an existing template or create a custom template as required.
Template
This parameter is valid only when Use template is selected.
Select the template to be imported. If no alarm template is available, click Create Custom Template to create one that meets your requirements.
Alarm Policy
This parameter is valid only when Create manually is selected.
Set the policy that triggers an alarm. For example, trigger an alarm if the CPU usage equals to or is greater than 80% for 3 consecutive periods.
Table 1 lists the DWS monitoring metrics.
Alarm Severity
Severity of an alarm. Valid values are Critical, Major, Minor, and Informational.
- Configure the alarm notification parameters as prompted.
Table 4 Configuring alarm notifications Parameter
Description
Alarm Notification
Whether to notify users when alarms are triggered. Notifications can be sent as emails or text messages, or HTTP/HTTPS requests sent to the servers.
You can select Yes (recommended) to enable notifications or select No to disable notifications.
Validity Period
Cloud Eye sends notifications only within the validity period specified in the alarm rule.
For example, if Validity Period is set to 00:00-8:00, Cloud Eye sends notifications only within 00:00-8:00.
Notification Object
Name of the topic to which the alarm notification is sent.
If you enable Alarm Notification, you need to select a topic. If no desired topics are available, create one first, whereupon the SMN service is invoked. For details about how to create a topic, see the Simple Message Notification User Guide.
For details about how to create a topic, see the Simple Message Notification User Guide.
Trigger Condition
Condition for triggering the alarm. You can select Generated alarm, Cleared alarm, or both.
- Click Create.
After the alarm rule is created, if the metric data reaches the specified threshold, Cloud Eye will immediately inform you that an exception has occurred.