This section describes the parameters of a text component.
Fields
- Manual input: Enter a text in the Text Content text box.
- Dynamic fields
In the category axis/dimension and axis value/metric lists, select fields and drag and drop them to the Text Settings/Dimensions or Metrics area.
The field list also includes the following features to help you analyze data:
- Set the field display content (Category Axis/Dimension).
Click
 in the column, select Field Display Content and click to modify the field display content on the displayed page. Click OK.
 - Set the aggregation mode (Axis Value/Metric).
Click
 of the field in the column, select Aggregation Method and click to support setting of no aggregation, sum, count, distinct count, maximum value, minimum value, average value, population standard deviation, sample standard deviation, sample variance, range start value, and range end value.
 - Filter: If you have a large amount of data, you can enable the filter function to filter out the required data categories from the dataset. Filters can filter character, numeric, and date data.
Filter Settings: Click
 next to the field you wish to filter and you will be directed to the filter settings page.
- Filter field selection dimension
- Non-time fields
Table 1 Filter parameters Parameter
Description
Dataset
The dataset selected for constructing the large screen component.
Selected Field
The fields selected for filtering (non-time fields).
Filter Mode
When the selected field is a dimension, filtering can be done by condition or enumeration.
Condition Type
When the selected field is a dimension and filtering is done by condition, both AND and OR conditions are supported.
When the selected field is a dimension and filtering is done by enumeration, single or multiple selections are supported.
Filter Criteria
When the selected field is a dimension and filtering is done by condition, the following conditions can be set: exact match, contains, starts with, does not match, does not contain, is empty, is not empty, etc.
When the selected field is a dimension and filtering is done by enumeration, the corresponding field can be selected.
- Time fields
Table 2 Filter parameters Parameter
Description
Dataset
The dataset selected for constructing the large screen component.
Selected Field
The fields selected for filtering (time fields).
Filter Mode
When the selected field is a dimension, filtering can be done by single value, range value, or condition.
Filter Criteria
When the selected field is a dimension and filtering is done by single value or range value, the filtering conditions support both absolute and relative time.
When the selected field is a dimension and filtering is done by condition, both AND and OR conditions are supported.
- Non-time fields
- Filter field selection metric
Table 3 Filter parameters Parameter
Description
Dataset
The dataset selected for constructing the large screen component.
Selected Field
Select the fields to be filtered.
Condition Type
When the selected field is a metric and filtering is done by condition, both AND and OR conditions are supported.
Filter Criteria
When the field to be set is a metric, filtering conditions support settings such as >, ≥, <, ≤, =, ≠, is empty, is not empty, etc. It also supports settings before and after data aggregation.
- Filter field selection dimension
- Sorting: Sorts the dragged class axis/dimension fields in ascending or descending order.
Sorting settings: Click
 of the sorting field and choose the desired order.Note
- Sorting by dimension: Drag and drop dimension fields into the sorting slots to display them in the chart.
- Sorting by metric: Metric fields in the sorting slots are not displayed in the chart by default. To display them, drag and drop them into the metric slots.
- Set Maximum Query Results. The value ranges from 1 to 5000.
- Auto Update: Set the time for data refresh, which can be 1 minute, 5 minutes, 15 minutes, 30 minutes, or Not update.
- Click Update to automatically update the chart.
- Set the field display content (Category Axis/Dimension).
Styles
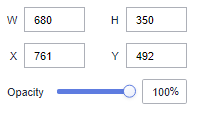
- Size/Position
- W: width of the target, in pixels.
- H: height of the target, in pixels.
- X: position of the target on the canvas, in pixels.
- Y: position of the target on the canvas, in pixels.
- Opacity: Adjust the transparency of the target on the canvas using a slider or by manually entering a percentage. A higher percentage means lower transparency.
Figure 1 Size/Position
- Global Style
- Overflow Scrolling: Once selected, the system plays the text in rotation if the text overflows.
- Scrolling Time: Enter a value or click the buttons to set the text scrolling duration. Scrolling Time is available only when Overflow Scrolling is selected.
- Text style
- Delimiter: Set the text separator.
- Font: Select a font.
- Font Size: Set the font size.
- Text Spacing: Set the spacing of the text in the title.
- Color: Select a font color.
- Font Weight: Set the font width of the title text.
- Alignment: Select the alignment mode of the title text. The value can be Center Horizontally, Left, or Right.
- Align Top and Bottom: Select the alignment mode of the title text. The value can be Center, Align Top, or Align Bottom.
- Row Height: Enter a value to adjust the spacing between lines in the text.
- First Line Indentation: Enter a value to adjust the first line indent of the text.
- Value Settings: You can set the context, units, scientific notation, use of thousand separators, and decimal places for numerical values.
Interactions
- Interaction Definition
- Click Interactions.
- Expand Interaction Definition and click Edit interaction event.
Figure 2 Edit interaction page
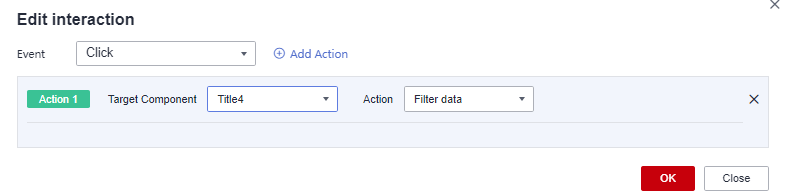
- Set Event to Click.
- Click Add Action to add an action. Actions can be changed between hidden and visible states, with different action values displayed depending on the selected widget.
- Click OK to complete the setting of the interaction event.Note
- Data filtering operators are categorized by string, number, and date types.
- String operators support exact matches, inequalities, inclusions, exclusions, prefixes, suffixes, and checks for emptiness.
- Number operators allow for equality, inequality, range comparisons, and checks for emptiness.
- Date operators support equality and range comparisons.
- Data filtering operators are categorized by string, number, and date types.