This section describes basic information about a Gantt chart and how to use the chart.
Field
- On the Field tab, double-click or drag the required dimensions and metrics to the Dimension and Metric areas.
- Set a filter.
- Find the data field you need in the dimension and metric lists within the data column.
- Click
 next to the field you wish to filter and you will be directed to the filter settings page.
 - Click OK.
Table 1 Filter parameters Type
Parameter
Description
string
Condition
Filter Mode: The options are Condition and Enumeration.
Condition Type: The options are And condition and Or condition.
Filter Condition: The options are Exact match, Contain, Start with, End with, Not match, Not contain, Null, and Not null.
Enumeration
Query Mode: The options are Single-select and multi-select.
Filter Condition: The options are >, ≥, <, ≤, =, ≠, Null, and Not null.
Metric
Condition Type
The options are And condition and Or condition.
Filter Condition
The options are >, ≥, <, ≤, =, ≠, Null, and Not null. You can select Before aggregation and After aggregation for data.
NOTE:If you select Before aggregation, data is filtered before aggregation. If you select After aggregation, data is filtered after aggregation. For aggregation concepts, see Creating a Dataset.
You can click Create Filter Condition to set multiple filter criteria.
Date
Range value
Select a time range for filtering.
Single value
Set a single time for filtering.
Condition
You can select And condition or Or condition as the condition type and select filter condition like >, ≥, <, ≤, and =.
You can click Create Filter Condition to set multiple filter criteria.
- Set the maximum number of query results.
Enter the maximum number of records that can be returned in the text box. The default value is 1000.
- Set automatic refresh.
The auto refresh interval supports the following options: no refresh, 1 minute, 5 minutes, 15 minutes, and 30 minutes.
Style
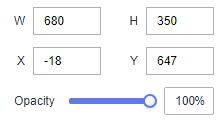
- Size/Position
- W: width of the target, in pixels.
- H: height of the target, in pixels.
- X: position of the target on the canvas, in pixels.
- Y: position of the target on the canvas, in pixels.
- Opacity: Adjust the transparency of the target on the canvas using a slider or by manually entering a percentage. A higher percentage means lower transparency.
Figure 1 Size/Position
- Global Style
Font: font of the text in the chart.
Figure 2 Global Style
- Gantt Chart Style
- Chart Label
- Font Size: font size of the Gantt chart label, which can be customized. The value ranges from 10 to 100.
- Color: color of the Gantt chart label, which can be customized.
- Font Weight: The options include Normal, Bold, Bolder, and Lighter.
- Status-Color Configuration: Obtain the range of status enumerated values based on the Status/Dimension area on the Fields tab and customize the colors for the values.
- Chart Label
- Margin: You can customize the top, bottom, left, and right margins of the Gantt chart.
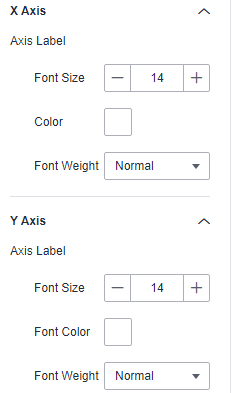
- X Axis/Y Axis
Axis Label: font size, font color, and font weight of the X axis and Y axis labels.
Figure 3 X/Y axis
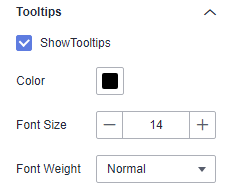
- Tooltips
- Show Tooltips: If the checkbox is selected (
 ), a tooltip is displayed when you preview or view a published component. If the checkbox is not selected (
 ), no tooltip is displayed when you preview or view a published component.
 - Color: font color of tooltips.
- Font Size: font size of tooltips.
- Font Weight: font weight of tooltips.
Figure 4 Tooltips
- Show Tooltips: If the checkbox is selected (
Example of Using a Gantt Chart
Display the optimal sales period for a store's products.
- Displays data.
Table 2 Product type table Product Type
Product Name
Color
Start Date
End Time
Mobile phone
Mobile phone A
White
May 2023
July 2, 2023
Mobile phone
Mobile phone B
Red
May 2023
July 3, 2023
Mobile phone
Mobile phone C
Black
May 2023
August 4, 2023
Desktop computer
Computer A
Black
January 2023
August 5, 2023
Desktop computer
Computer B
Black
May 2023
August 6, 2023
Desktop computer
Computer C
Black
May 2023
August 7, 2023
Tablet
Tablet D
Red
May 2023
August 8, 2023
Tablet
Tablet M
Pink
June 2023
August 9, 2023
Laptop
Laptop A
Pink
June 2023
August 10, 2023
Laptop
Laptop C
Red
June 2023
August 11, 2023
- Procedure
- Click
 in the upper left corner to select a region.
 - In the lower left corner of the navigation pane, select an enterprise project from Enterprise Project.
- Create a project.
- Create a data source.
- Create a dataset by referring to Creating a Dataset.
- Create a large screen by referring to Creating a Large Screen. In the Common charts area in the left pane, select Gantt Chart and create it.
- Select the dataset created in Creating a Dataset and drag and drop the corresponding fields to the Title/Dimension, Name/Dimension, Status/Dimension, Start Time/Dimension, and End Time/Dimension areas.
- Click Update in the lower right corner. The Gantt chart displays data. Set the Gantt chart based on the style parameters.
- Click