A radar chart can display analyzed data or ratios, allowing you to easily view various data indicators and trends. It maps the data of multiple dimensions onto a coordinate axis that starts at the same center point and ends at the circumference, connecting the points of the same group with lines. This chart is often used to show the distribution of dimension values. This section will introduce the configuration of radar charts.
Fields
- In the Data area on the right, select a dataset, and double-click or drag required dimension and metric fields to the corresponding areas on the Fields tab.
Table 1 Parameters on the Fields tab Parameter
Description
Field display content
Click
 in the column and click Field display content to modify the field display content on the displayed page. Click OK.
Aggregation Mode
Select Aggregation Method and click to support setting of no aggregation, sum, count, distinct count, maximum value, minimum value, average value, population standard deviation, sample standard deviation, sample variance, range start value, and range end value.
- Set the color legend. Specifically, drag the required field to Color Legend.
- Set a filter.
- Find the data field you need in the dimension and metric lists within the data column.
- Click
 next to the field you wish to filter and you will be directed to the filter settings page.
 - Click OK.
Table 2 Filter parameters Type
Parameter
Description
string
Condition
Filter Mode: The options are Condition and Enumeration.
Condition Type: The options are And condition and Or condition.
Filter Condition: The options are Exact match, Contain, Start with, End with, Not match, Not contain, Null, and Not null.
Enumeration
Query Mode: The options are Single-select and multi-select.
Filter Condition: The options are >, ≥, <, ≤, =, ≠, Null, and Not null.
Metric
Condition Type
The options are And condition and Or condition.
Filter Condition
The options are >, ≥, <, ≤, =, ≠, Null, and Not null. You can select Before aggregation and After aggregation for data.
NOTE:If you select Before aggregation, data is filtered before aggregation. If you select After aggregation, data is filtered after aggregation. For aggregation concepts, see Creating a Dataset.
You can click Create Filter Condition to set multiple filter criteria.
Date
Range value
Select a time range for filtering.
Single value
Set a single time for filtering.
Condition
You can select And condition or Or condition as the condition type and select filter condition like >, ≥, <, ≤, and =.
You can click Create Filter Condition to set multiple filter criteria.
- Set sorting.
- Drag and drop required data fields from the Dimension and Metric (Indicator) areas under Data to the Sorting area.
- Click
 next to a field in the Sorting area and select a sorting mode. The sorting modes are Ascending, Descending, and Custom.
 - To cancel sorting, click
 next to the sorting field.
- Set the maximum number of query results.
Enter the maximum number of records that can be returned in the text box. The default value is 1000.
- Set automatic refresh.
The auto refresh interval supports the following options: no refresh, 1 minute, 5 minutes, 15 minutes, and 30 minutes.
Styles
- Size/Position
- W: width of the target, in pixels.
- H: height of the target, in pixels.
- X: position of the target on the canvas, in pixels.
- Y: position of the target on the canvas, in pixels.
- Opacity: Adjust the transparency of the target on the canvas using a slider or by manually entering a percentage. A higher percentage means lower transparency.
Figure 1 Size/Position

- Global Style: You can customize the font style of the radar chart, which is set to Microsoft YaHei by default.
- Legend
- Show Legend: If the checkbox is selected (
 ), legends are displayed. If the checkbox is not selected (
 ), legends are hidden.
 - Display Metric Name: whether to display the metric name.
- Data Value: whether to display data value.
- Proportion Display: whether to display the proportion.
- Text: text style of the legend, including Font Size, Color, and Font Weight.
- Layout: You can set the direction, position, left and right spacing, top and bottom spacing, and legend spacing.
- Legend Mark: You can set the mark type, width, and height.
Figure 2 Legend
- Show Legend: If the checkbox is selected (
- Label Attribute
- ShowLabelAttribute: To show/hide label attributes, click the checkbox next to ShowLabelAttribute.
 indicates that label attributes are displayed, while
  indicates that they are hidden.
 - You can customize the font size, color, and font weight of label attributes. The font size ranges from 10 to 100.
- ShowLabelAttribute: To show/hide label attributes, click the checkbox next to ShowLabelAttribute.
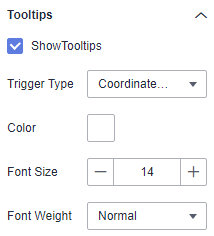
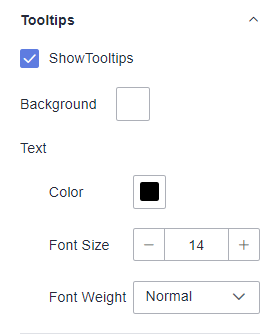
- Tooltips
- ShowTooltips: Select (
 ) or deselect (
 ) the check box to show or hide the tooltips when you preview or view a published component.
 - Data Name: whether to display the data name.
- Color: font color of tooltips.
- Font Size: font size of tooltips.
- Font Weight: font weight of tooltips.
Figure 3 Tooltips
- ShowTooltips: Select (
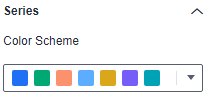
- Series
- Color Scheme: Supports default, classic, comfort, intelligence, data, art, and SaaS specifications color schemes.
Figure 4 Color scheme
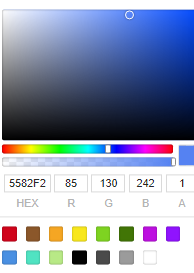
- Series: You can set the colors of the series.
Figure 5 Series color configuration
- Color Scheme: Supports default, classic, comfort, intelligence, data, art, and SaaS specifications color schemes.
Chart Display
Figure 6 Radar chart
