Scenario
Large screens are designed for enterprise data consumers. They combine visualization and storytelling techniques and run on intelligent devices. They are cool, non-contact large screens that meet the needs of business monitoring, project meeting presentations, and media screens, promoting enterprise data consumption.
Common applications of data large screens include monitoring event data, presenting project meetings, and external receptions. They are an important part of DataArts Insight's analysis scenarios.
This case study simulates a company's user and product sales data, and uses DataArts Insight to create a large screen with various data features of users and products.
Process
Figure 1 Creating a large screen

Step 1: Prepare Data
Before creating a large screen, complete the following preparations: As the current case uses the same data as the typical dashboard example, you can refer to Example Typical Scenario: Analyzing Sales Data of a Product Using DataArts Insight for data preparation.
- Create a project by referring to Step 1: Create a Project.
- Connect to a data source by referring to Step 2: Connect to a Data Source.
- Create a dataset by referring to Step 3: Create a Dataset.
Step 2: Create a Large Screen
- In the navigation pane of your project, choose Data Management > Datasets.
- Find the desired dataset in the list and click Create Screen in the Operation column.
- In the left pane, drag required components to the canvas. You can also click to add components. In this example, we will use a rose chart to demonstrate how to create and configure large screen components.
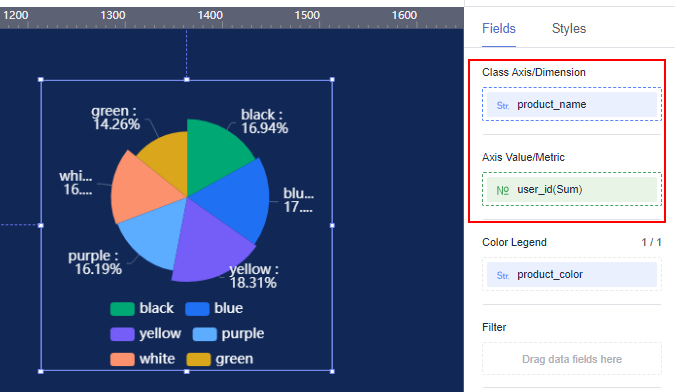
- Select a dataset for the component, drag required fields from the right pane to the chart, and configure the fields.
- Click Update to generate a chart on the canvas.
In this example, you can view the distribution of users at different levels who purchased products. You can also customize the chart's configuration through the style options.
Figure 2 Configuring fields