This section describes how to create an indicator.
Preparations
- A project has been created by referring to Creating a Project.
- A data source has been created by referring to Connecting to a Data Source.
- A dataset has been created by referring to Creating a Dataset.
Procedure
- Click
 in the upper left corner to select a region.
 - In the lower left corner of the navigation pane, select an enterprise project from Enterprise Project.
- Select the desired project and click the name to access the project.
- Choose Data Management > Indicator.
- Click Create Indicator in the upper right corner.
Figure 1 Create Indicator
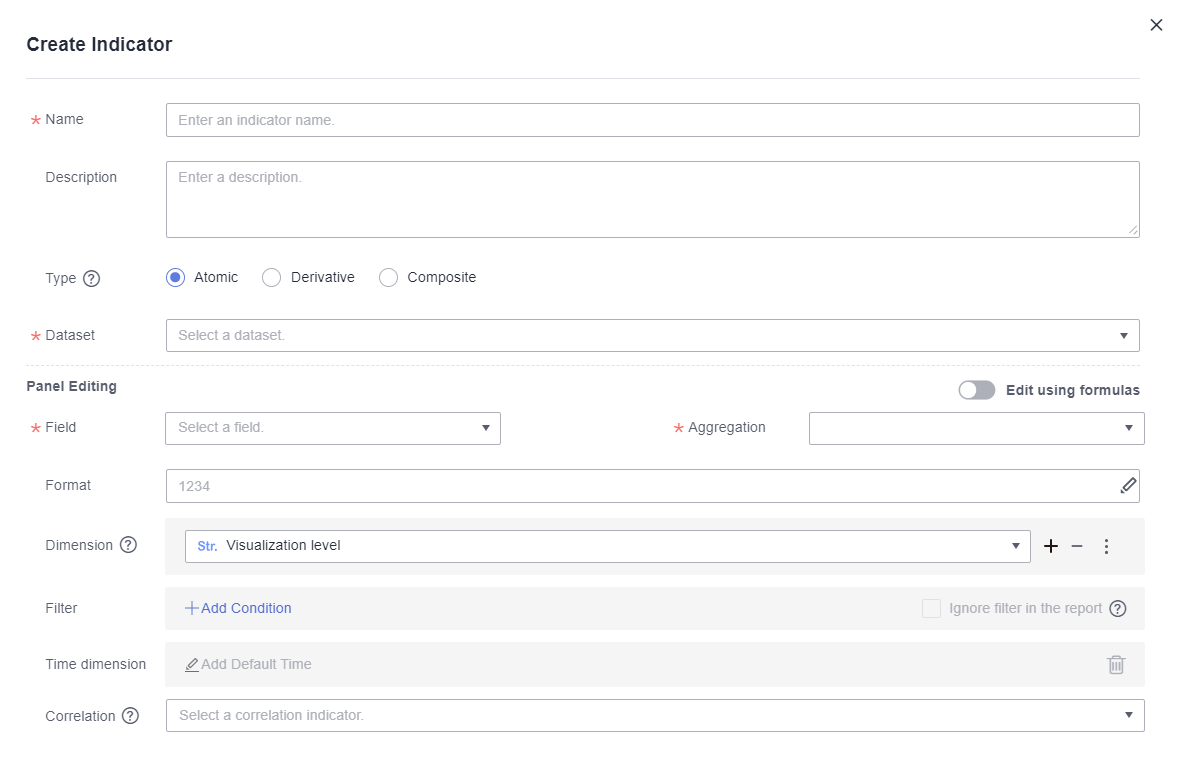
- Set parameters and click OK.
Table 1 Indicator parameters Parameter
Description
Name
Name of the indicator, which is user-defined.
NOTE:The maximum length for the name is 512 characters. Only letters, digits, brackets, slashes (/), backslashes (\), underscores (_), and hyphens (-) are allowed.
Description
Description of the indicator.
Type
Atomic indicators are quantitative measures of a product or business performance, such as sales revenue.
Derivative indicators are extensions of a single indicator commonly used to expand indicators over time, such as the sales revenue compared to the previous month.
Composite indicators are based on multiple indicators and defined by input expressions, such as profit = sales revenue – cost.
Dataset
Dataset you want to associate with the indicator.
Field
Dimensions and metrics.
Aggregation
The options include Sum, Average, Count, Distinct count, Maximum, Minimum, Population standard deviation, Sample standard deviation, Population variance, and Sample variance.
Derivative
The options include YoY and PoP growth rate, YoY and PoP growth, Period-to-date, Moving calculation, Cumulative calculation, Ranking, Difference, Difference percentage, and Total percentage.
Format
The options include No format, Numeric, Currency, Object quantifier, Length, Weight, Energy, Capacity, Time, and Percentage.
Dimension
You can select the dimensions from which indicator values are analyzed.
NOTE:If Dimension is set to Visualization level, all dimensions are associated by default.
Filter
It is used to add filter rules.
- Click Add Condition.
- Select the filter field, filter type, fixed value filtering condition, and value.
- Filter Field: Filter the dataset fields for which rules need to be set. You can select only one dimension or metric field. To configure rules for other fields, add more conditions.
- Filter Type: Select Condition, Enumeration, or Expression filtering.
- Fixed value filtering condition: The options include Equal to, Not equal to, and more.
- Fixed Value: Enter the value of the filtering condition. For enumeration filtering, select a field value from the drop-down list box.
To set rules for other fields, click Create Rule.
If there are multiple condition rules, set the relationship between the rules.
- AND: You can view the field values that meet both rules A and B.
- OR: You can view the field values that meet either rule A or B.
- To add a rule that is parallel to rule A and rule B, click Add Relationship to create a new rule group, rule C. which is on the same level as rules A and B.
Ignore Report Filter
When there are duplicate column filters on a report, selecting this parameter will ignore the report-level filters. If not selected, the filter will intersect with the report-level filters.
Table 2 Numeric functions Function
Usage
Description
ABS
ABS(x)
Returns the absolute value of x.
CEIL
CEIL(x)
Returns the smallest integer greater than or equal to x.
FLOOR
FLOOR(x)
Returns the largest integer less than or equal to x.
RANDOM
RANDOM()
Returns a random number ranging from 0.0 to 1.0.
SIGN
SIGN(x)
Returns the sign of x, which is either -1, 0, or 1 depending on whether x is negative, zero, or positive.
PI
PI()
Returns pi.
TRUNC
TRUNC(x, y)
Returns the value of x rounded to y decimal places.
ROUND
ROUND(x)
Returns the value of x rounded to y decimal places, with any truncated part being rounded off.
POWER
POWER(x,y)
Returns the value of x raised to the power of y.
SQRT
SQRT(x)
Returns the square root of x.
EXP
EXP(x)
Returns the value of e raised to the power of x.
MOD
MOD(x,y)
Returns the remainder when x is divided by y.
LOG
LOG(x)
In the ORA- or TD-compatible mode, this operator means the logarithm with 10 as the base. In the MySQL-compatible mode, this operator means the natural logarithm.
RADIANS
RADIANS(x)
Converts the angle to a radian.
DEGREES
DEGREES(x)
Converts the radian to an angle.
SIN
SIN(x)
Calculates the sine value given in radians.
ASIN
ASIN(x)
Calculates the arc sine value given in radians.
COS
COS(x)
Calculates the cosine value given in radians.
ACOS
ACOS(x)
Calculates the arc cosine value given in radians.
TAN
TAN(x)
Calculates the tangent value given in radians.
ATAN
ATAN(x)
Calculates the arc tangent value given in radians.
COT
COT(x)
Calculates the cotangent value given in radians.
Table 3 Window functions Function
Usage
Description
RANK_WINDOWS
RANK() OVER (PARTITIONBY expr1 ORDER BY expr2)
The RANK function is used for generating non-consecutive sequence numbers for the values in each group. The same values have the same sequence number.
ROW_NUMBER_WINDOWS
ROW_NUMBER() OVER(PARTITION BY expr1 ORDER BY expr2)
The ROW_NUMBER function is used for generating consecutive sequence numbers for the values in each group. The same values have different sequence numbers.
AGG_WINDOWS
agg_func(x) OVER(PARTITION BY expr1 ORDER BY expr2)
agg_fun(x) is an aggregate function, for example, sum(x) and arg(x).
Table 4 Aggregate functions Function
Usage
Description
AVG
AVG(x)
Returns the average value in the column x.
COUNT
COUNT(x)
Returns the number of non-null values in the column x.
MAX
MAX(x)
Returns the largest value of the column x.
MIN
MIN(x)
Returns the smallest value of the column x.
SUM
SUM(x)
Returns the sum of the values in column x.
VAR_POP
VAR_POP(x)
Returns the population variance in the column x.
VAR_SAMP
VAR_SAMP(x)
Returns the sample variance in the column x.
STDDEV_SAMP
STDDEV_SAMP(x)
Returns the standard deviation of samples in the column x.
STDDEV_POP
STDDEV_POP(x)
Returns the population standard deviation in the column x.