You can create a multi-layered map and overlay multiple bubble charts and jump line charts on it, to present various types of data. This section describes the parameters of a multi-layered map.
Prerequisites
- A project has been created by referring to Creating a Project.
- A data source has been connected by referring to Creating a Data Source.
- A dataset has been created by referring to Creating a Dataset.
- A large screen has been created by referring to Creating a Large Screen.
Procedure
- Click the Maps icon in the left navigation pane to switch to the map component page.
- Click or drag a map component to the canvas.
- In the data configuration area on the right, select a dataset.
- Set parameters on the Field and Styles tabs.
- Click Update. The system automatically updates the chart.
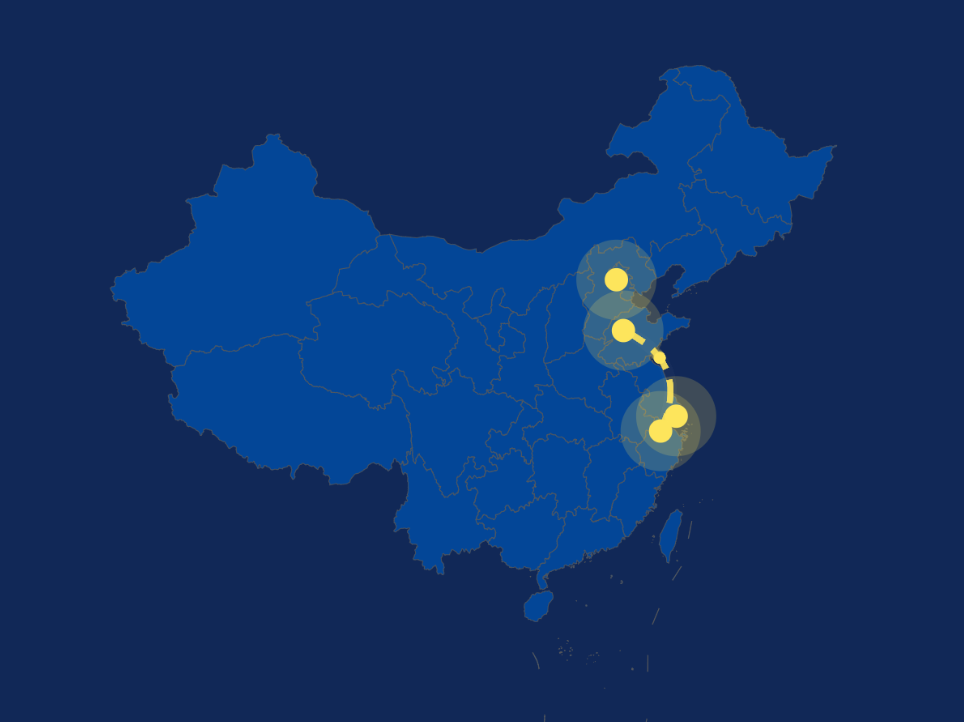
Figure 1 Multi-layered map
Fields
- In the Data area on the right, select a dataset, and double-click or drag required dimension and metric fields to the corresponding areas on the Fields tab.
- Set a filter.
- Find the data field you need in the dimension and metric lists within the data column.
- Click
 next to the field you wish to filter and you will be directed to the filter settings page.
 - Click OK.
Table 1 Filter parameters Type
Parameter
Description
string
Condition
Filter Mode: The options are Condition and Enumeration.
Condition Type: The options are And condition and Or condition.
Filter Condition: The options are Exact match, Contain, Start with, End with, Not match, Not contain, Null, and Not null.
Enumeration
Query Mode: The options are Single-select and multi-select.
Filter Condition: The options are >, ≥, <, ≤, =, ≠, Null, and Not null.
Metric
Condition Type
The options are And condition and Or condition.
Filter Condition
The options are >, ≥, <, ≤, =, ≠, Null, and Not null. You can select Before aggregation and After aggregation for data.
NOTE:If you select Before aggregation, data is filtered before aggregation. If you select After aggregation, data is filtered after aggregation. For aggregation concepts, see Creating a Dataset.
You can click Create Filter Condition to set multiple filter criteria.
Date
Range value
Select a time range for filtering.
Single value
Set a single time for filtering.
Condition
You can select And condition or Or condition as the condition type and select filter condition like >, ≥, <, ≤, and =.
You can click Create Filter Condition to set multiple filter criteria.
- Set the maximum number of query results.
Enter the maximum number of records that can be returned in the text box. The default value is 1000.
- Set automatic refresh.
The auto refresh interval supports the following options: no refresh, 1 minute, 5 minutes, 15 minutes, and 30 minutes.
- After settings the fields, select Boundary Data Source in the style, and click Update. The system will automatically update the chart.
Styles
Parameter | Description |
|---|---|
Size/Position | Set the width (W) and height (H) of the chart, in pixels. Set the position of the target on the canvas, in pixels. Adjust the transparency of the chart on the canvas, with a higher proportion resulting in lower transparency. |
Sublayer - Bubble Layer | Bubble Style: Set Bubble Color, Bubble Size, Enable Bubble Animation, Bubble Style, and Animation Speed. Label: If selected, labels are displayed on the map. You can set the content, position, and text size of labels. Tooltips: If selected, tooltips appear on the map. You can set Background Color, Text, and Font Weight. |
Sublayer - Flight Line Layer | Flight Line Style: In this area, you can set Flight Line Color, Flight Line Style, Flight Line Thickness, and Flight Line Arc. Landing Bubble: When checked, the map will display landing bubbles. You can set Bubble Color, Bubble Size, Enable Bubble Animation, Bubble Style, and Animation Speed. Label: If selected, labels are displayed on the map. You can set the content, position, and text size of labels. Tooltips: If selected, tooltips appear on the map. You can set Background Color, Text, and Font Weight. |
Common Configuration | Global Style
Legend
|