This section describes the parameters of a treemap chart.
Notes and Constraints
- Only one field can be dragged to Class Block Label/Dimension.
- Only one field can be dragged to Class Block Size/Metric.
Fields
- In the Data area on the right, select a dataset, and double-click or drag required dimension and metric fields to the corresponding areas on the Fields tab.
- Set a filter.
- Find the data field you need in the dimension and metric lists within the data column.
- Click
 next to the field you wish to filter and you will be directed to the filter settings page.
 - Click OK.
Table 1 Filter parameters Type
Parameter
Description
string
Condition
Filter Mode: The options are Condition and Enumeration.
Condition Type: The options are And condition and Or condition.
Filter Condition: The options are Exact match, Contain, Start with, End with, Not match, Not contain, Null, and Not null.
Enumeration
Query Mode: The options are Single-select and multi-select.
Filter Condition: The options are >, ≥, <, ≤, =, ≠, Null, and Not null.
Metric
Condition Type
The options are And condition and Or condition.
Filter Condition
The options are >, ≥, <, ≤, =, ≠, Null, and Not null. You can select Before aggregation and After aggregation for data.
NOTE:If you select Before aggregation, data is filtered before aggregation. If you select After aggregation, data is filtered after aggregation. For aggregation concepts, see Creating a Dataset.
You can click Create Filter Condition to set multiple filter criteria.
Date
Range value
Select a time range for filtering.
Single value
Set a single time for filtering.
Condition
You can select And condition or Or condition as the condition type and select filter condition like >, ≥, <, ≤, and =.
You can click Create Filter Condition to set multiple filter criteria.
- Set the maximum number of query results.
Enter the maximum number of records that can be returned in the text box. The default value is 1000.
- Set automatic refresh.
The auto refresh interval supports the following options: no refresh, 1 minute, 5 minutes, 15 minutes, and 30 minutes.
Style
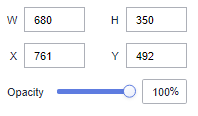
- Size/Position
- W: width of the target, in pixels.
- H: height of the target, in pixels.
- X: position of the target on the canvas, in pixels.
- Y: position of the target on the canvas, in pixels.
- Opacity: Adjust the transparency of the target on the canvas using a slider or by manually entering a percentage. A higher percentage means lower transparency.
Figure 1 Size/Position
- Global Style: Set a font type.
- Basic Chart Style
- Merge Data into Other: Selecting this option will display a combined number of data blocks in the rectangle tree, as opposed to the raw number returned by the field.
- Blocks After Merge: Customize the number of data blocks to merge, with a minimum of two required. If the combined total exceeds the query return limit, the displayed number in the rectangle tree will match the query return limit.
- Block Name: Enter a name.
- Label
- Text: Set the font, color, and font width. The font size ranges from 10 to 100.
- Proportion: Set the proportion color of the treemap chart. The value ranges from 0 to 10.
- Metric: Select this to display measures in a treemap chart.
Value Settings: Set the context, units, scientific notation, use of thousand separators, and decimal places for numerical values.
- Tooltips
- ShowTooltips: Select or deselect the check box to show or hide the tooltips when you preview or view a published component.
- You can set the font size, color, and font width. The font size ranges from 10 to 100.
- Series
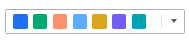
- Color Scheme: Select default, classic, comfort, intelligence, data, art, or SaaS specifications color schemes.
Figure 2 Color scheme
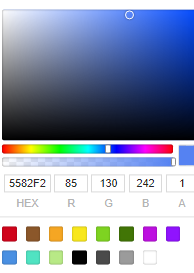
- Series: Set the colors (solid) of the series.
Figure 3 Series color settings
- Color Scheme: Select default, classic, comfort, intelligence, data, art, or SaaS specifications color schemes.
- Total
- ShowTotal: Select or deselect this to show or hide the total statistics.
- Custom Name: Enter a name.
- You can set the font size, color, and font width. The font size ranges from 10 to 100.