DataArts Insight datasets form the foundation for visualized analysis. You can create a dataset using the data source you want to analyze. DataArts Insight allows you to create a dataset through visual configuration or custom SQL statements. This section describes how to create a dataset through visual configuration.
Prerequisites
- A project has been created by referring to Creating a Project.
- The target data source has been connected. For details, see Creating a Data Source.
Selecting a Data Table
- Click
 in the upper left corner to select a region.
 - In the lower left corner of the navigation pane, select an enterprise project from Enterprise Project.
- Click the name of the target project to access it.
- In the navigation pane, choose Data Sources and then click the target data source.
- Locate the target data table and click Create Dataset in the Operation column.
- Double-click or drag a data table to the canvas.
- Click Refresh Preview in the data preview area to view the read table data.
- Click
 next to the data table and select the table fields you want to display.
Figure 1 Select Field
- To cascade multiple tables, associate with data tables by referring to Creating a Model by Associating Multiple Tables.
- To set configuration fields, see Configuring the Field Tree in a Data Table and (Optional) Visual Field Configuration.
- After the fields are configured, click Save in the upper right corner of the page.
- Enter the dataset name and click OK.
Configuring the Field Tree in a Data Table
After a data table is opened, you can preview the data as well as the dimension and metric fields for further analysis.
You can configure dataset fields as needed, including editing, cloning, hiding, copying as metrics, converting to metrics or dimensions, setting default aggregation mode, choosing value display format, and deleting.
- If a data table contains more than 100 records, you can only preview the first 100. However, if the table has 100 records or less, you can preview all of them.
- Once a field is used in calculation fields, grouping dimensions, or filter criteria, you cannot modify its type, perform dimension or metric conversions on it, or delete it.
- Currently, the date field cannot be copied. You can convert the date field to the text type and then copy the field.
To configure fields, perform the following steps:
- In the field list area, click
 next to a field to configure the field.
 - In the data preview area, click
 next to a field to configure the field.
 Figure 2 Configuring fields
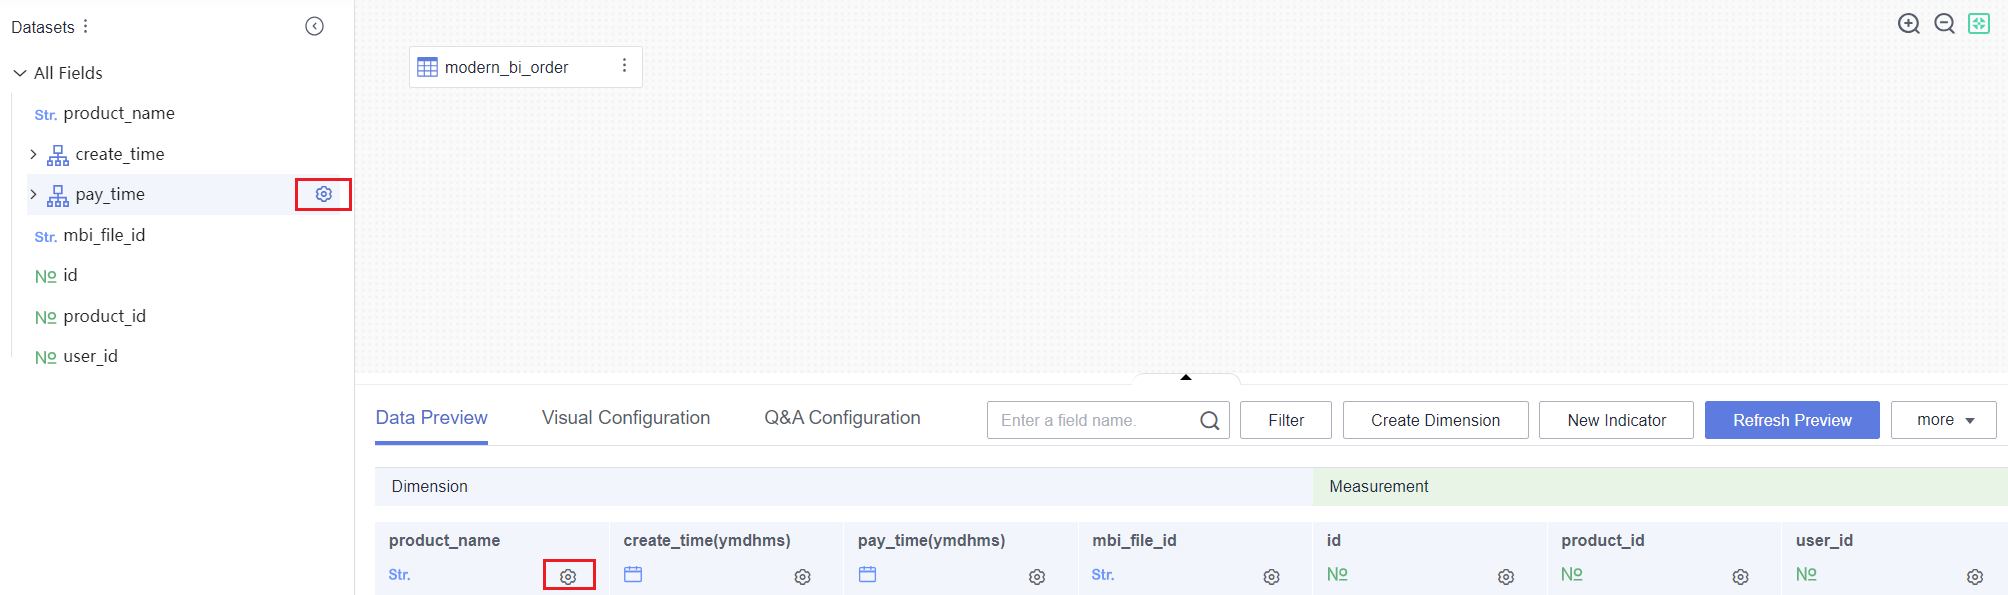
Table 1 describes the configuration items of the dataset column fields.
Function | Description |
|---|---|
Edit | Edit the name and description of the field.
|
Clone | Quickly copy a field. The new field contains the backup identifier.
|
Hide | Hide a field. After a field is hidden, this field will not be displayed when you use this dataset to create a dashboard or large screen. |
Numeric Display Format | Select No format, Numeric, Currency, Object quantifier, Length, Weight, Energy, Capacity, Time, or Percentage. |
Convert to Metric/Dimension | Change the field type from dimension to metric or vice versa. |
Convert Dimension Type | Convert a dimension or metric field to another type, such as a number, date, or text. You can configure the data format for a date field. |
Delete | Delete a field. To retrieve the field after it is deleted, click the table in the canvas and select and add the field in the right pane. |

(Optional) Visual Field Configuration
DataArts Insight provides visual dataset configuration, which facilitates dataset field configuration.
Visual configuration is not required when you configure fields in the field tree.
- On the dataset creation page, click Visual Configuration.
- Edit the fields as needed.
Table 2 Visual configuration parameters Parameter
Description
Field Name | Physical Field
- You can customize field names, which will be shown in charts on dashboards and large screens.
- Physical fields cannot be modified.
Field Type
Type supported by a field, including date, text, and number. A date can be set in multiple formats.
Default Aggregation
The aggregation mode can be set only for metric fields.
Select None, Sum, Average, Count, Distinct count, Maximum, Minimum, Population standard deviation, Sample standard deviation, Population variance, Sample variance, Range start value, or Range end value.
NOTE:You can only set either Range start value or Range end value, not both at the same time.
Numeric Display Format
Select No format, Numeric, Currency, Object quantifier, Length, Weight, Energy, Capacity, Time, or Percentage.
Field Description
Description of a field.
Allow Search
Determines whether the enumerated values used to label fields can be searched during training. Currently, only a maximum of 1,000 enumerated values can be extracted.
NOTE:It is supported only by the text type.
Operation
You can delete or hide a field. You can unhide a hidden field.
NOTE:Before deleting a field from a dataset, check whether the field is used in a large screen, report, or permission configuration.
- To configure multiple fields at once, select them and click the desired button in the Operation column.
You can convert dimensions to metrics in batches or vice versa, hide or unhide fields in batches, and delete fields in batches.