Scenario
Create data analytics dashboards by connecting DataArts Insight to external data sources and building datasets.
This case study simulates a company's user and product sales data, and uses DataArts Insight to analyze various data features of users and products, providing assistance for marketing decisions.
Procedure
Figure 1 Analyzing data using a dashboard

Data Description
To protect user privacy and data security, all data has been sampled and anonymized.
Field | Type | Description | Value Range |
|---|---|---|---|
user_id | Integer | User ID | Anonymized |
age | Integer | Age group | -1: unknown |
gender | Integer | Gender |
|
rank | Integer | User level | The greater the value of this field, the higher the user level. |
register_time | String | User registration date | Unit: day |
product_id | Integer | Product No. | Anonymized |
a1 | Integer | Attribute 1 | Enumerated value. The value -1 indicates unknown. |
a2 | Integer | Attribute 2 | Enumerated value. The value -1 indicates unknown. |
a3 | Integer | Attribute 3 | Enumerated value. The value -1 indicates unknown. |
category | Integer | Category ID | Anonymized |
brand | Integer | Brand ID | Anonymized |
time | String | Time of action | - |
model_id | String | Module ID | Anonymized |
type | String |
| - |
Step 1: Create a Project
- Log in to the DataArts Insight management console.
- Create a project space.
- Click Create Project in the upper right corner to create a project space.
- In the displayed dialog box, enter the project name and description.
- Click OK.Note
- The project name can contain only letters, digits, underscores (_), slashes (/), backslashes (\), vertical bars (|), parentheses (()), and square brackets ([]).
- The maximum length for a project name is 50 characters.
- The maximum length for a description is 512 characters.
- Click Create Project in the upper right corner to create a project space.
Step 2: Connect to a Data Source
The following uses connecting to the GaussDB(DWS) data source as an example. For details about how to connect to other data sources, see "Creating a Data Source" in DataArts Insight User Guide.
- Click the name of the project you created in the My Projects area in the right pane. In the navigation pane on the left, choose Data Management > Data Sources. On the displayed page, click Create Data Source.
- Source Database Type: Select a data source as the data input for data analysis.
In this example, DataArts Insight connects to GaussDB(DWS) through VPC.
Table 2 Parameters Parameter
Mandatory
Description
Source Database Type
Yes
Type of the accessed data source. In this example, GaussDB(DWS) is selected.
Access Network Type
Yes
In this example, GaussDB(DWS) is selected.
Region
Yes
Region where the GaussDB(DWS) service host is located.
Name
Yes
Name of the data source displayed in the list, which is user-defined.
Description
No
Description of the data source.
Instance
Yes
Role instance corresponding to the GaussDB (DWS) service.
Servers
Yes
List of GaussDB(DWS) servers.
NOTE:If the cluster is associated with an ELB, the ELB address will be automatically populated. However, if there is no ELB associated with the cluster, the IP address and port number of the first node will be used by default.
Database
Yes
Name of the database to be logged in to.
Username
Yes
Username for logging in to the database.
Password
Yes
Password for logging in to the database.
SASL_SSL
-
It is used for trusted identity authentication and secure data transmission when DataArts Insight retrieves data from the data source. This function is enabled by default.
- Click Test Connection.
- Once the connection test is successful, click OK.
Step 3: Create a Dataset
- In the navigation pane of your project, choose Data Management > Data Sources.
- Find the desired data table in the list and click Create Dataset in the Operation column.
- Click the refresh button in the upper right corner to view the data in the current data table.
- Click
 next to column fields to set these fields.
 - In this example, perform the following operation on column fields:
Hidden column fields: model_id and gender.
- Click Save on the right to save the dataset configuration.
- Enter the dataset name and click OK.
Step 4: Create a Dashboard
- Click Create Dashboard in the upper right corner of the page.
- Create a visual chart. In this example, a line chart is created. For details about how to create other visual charts, see "Visual Controls on a Dashboard" in DataArts Insight User Guide.
- OI the Field tab, select dimensions and metrics.
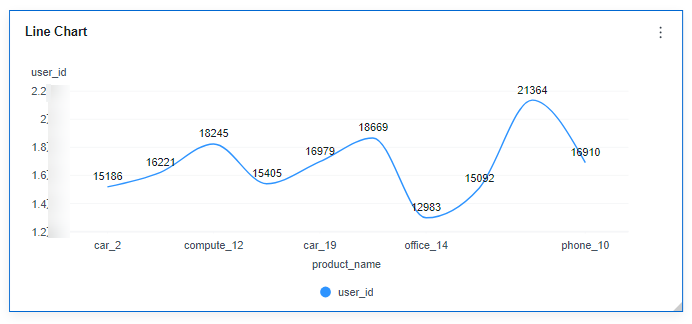
For example, to view the number of users who have purchased different categories of products, you can customize the chart type and data metrics as needed to create various types of charts.
- Click Update to obtain the required chart.
Figure 2 Number of users who have purchased different categories of products
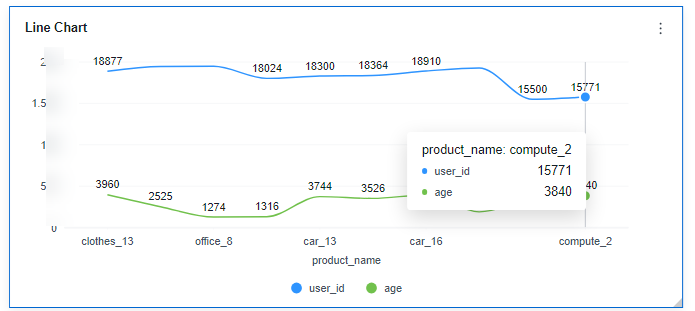
You can adjust the chart type and data metrics as needed to create different types of charts, such as viewing the number of users who purchased different products and the average age range of those users.
Figure 3 Number of users who purchased different products and the average age range of consuming users
- Click Save on the right to save the intelligent report.
- Enter the dashboard name and click OK.
You can also click Save and Publish to save and publish the dashboard. Once the dashboard is published, you can view it.
- OI the Field tab, select dimensions and metrics.
Step 5: View/Preview the Dashboard
Once a dashboard is created, you can preview and view it.
- Viewing a dashboard
You can only view the dashboards that have been published.
- In the navigation pane of your created project, choose Data Analytics > Dashboards.
Figure 4 Viewing a dashboard

- On the displayed page, locate the row containing a desired dashboard and click View in the Operation column to view the dashboard.
- In the navigation pane of your created project, choose Data Analytics > Dashboards.
- Previewing a dashboard
You can click Preview in the upper right corner to preview a dashboard.
Figure 5 Previewing a dashboard