Viewing Logs in CTS
When you enable CTS, the system starts recording operations on CPTS. CTS console stores operation records of the last seven days.
Scenario
When you enable CTS, the system starts recording operations on CPTS. CTS console stores operation records of the last seven days.
Procedure
- Log in to the CTS console.
- Click
 at the upper left corner, and select a region and project.
 - In the navigation pane, choose Cloud Trace Service > Trace List. The Trace List page is displayed.
- On the Trace List page, query traces based on the search criteria. The trace list supports four filter types:
- Trace Source, Resource Type, and Search By
Select a query condition from the drop-down list. For example, select CPTS from the Trace Source drop-down list.
From the Search By drop-down list, specify a trace name.
From the Search By drop-down list, select or enter a specific resource ID.
From the Search By drop-down list, select or enter a specific resource name.
- Trace Status: Available options include All trace statuses, Normal, Warning, and Incident. You can only select one of them.
- Operator: Select a specific operator (at the user level rather than the tenant level).
- Start Date and End Date: You can specify a time period to query traces.
- Trace Source, Resource Type, and Search By
- Click
 on the left of the record to be queried to view details.
 - Click View Trace on the right of the record to be queried. Details on this trace are displayed.
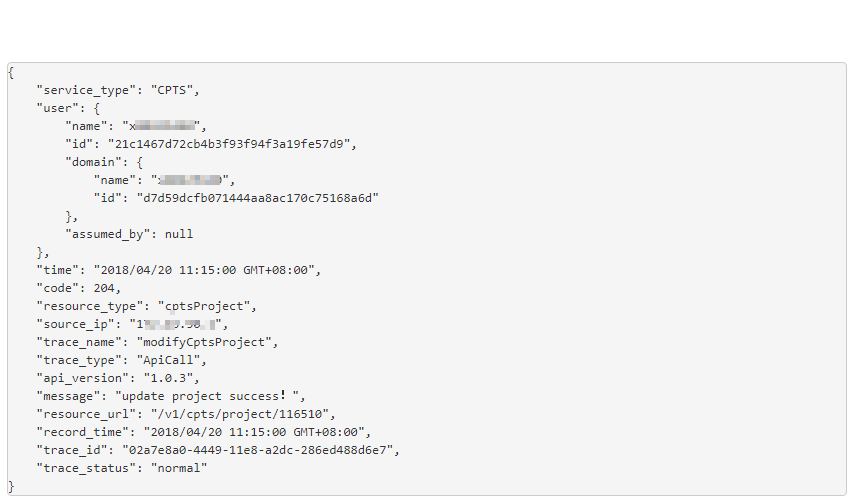
Figure 1 Viewing traces
Parent topic: Auditing
- Scenario
- Procedure