Viewing a Real-Time Test Report
You can view the monitored metrics and the SLA report during a performance test in a real-time test report.
Prerequisites
A test task has been started.
Procedure
- Log in to the CPTS console, choose CPTS Test Projects in the left navigation pane, and click More > View Real-Time Report on the row of a test project.
- On the Real-Time Reports tab page, select a task to view its test report.
Click Stop Task to stop viewing the real-time report.
- Select a case under the task and view the report. For details about the parameters, see Test Report Description.Note
- By default, the first case report is displayed. If no case is selected from the drop-down list, reports of all cases are displayed.
- You can select cases in batches under the task to view reports of multiple cases.
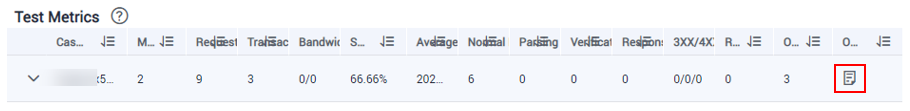
- You can click the expanding symbol before the case name under Test metrics, and select one or more packets of the case to view the performance metrics of these packets.
- (Optional) Click
 to zoom in the monitored metrics on the Service Report tab.
 - Perform tracing analysis and packet capturing analysis on the test task on the Service Report tab.
- Captured packet analysis: supports sampling packet capturing for requests and responses to locate problems during the test. A maximum of 100 requests and responses can be captured for each transaction at a time.Note
Captured packet analysis has been moved to logs, and data types to capture cannot be selected. Data will be randomly captured during testing.
Figure 1 Operation logs of test cases
- Monitoring metrics: CPU, memory, disk read, and disk write.
Table 1 Monitoring metrics Metric
Description
CPU (%)
CPU usage of a test object.
Memory (GB)
Memory usage of a test object.
Disk read (kbit/s)
Amount of data read from the test object per second.
Disk write (kbit/s)
Amount of data written to the test object per second.
- Tracing analysis: supports analysis of the failed tracing and topology relationship to locate problems during testing.
Table 2 Types that support tracing analysis Type
Description
Failed call chain
The failed call chain is displayed only when the invoking fails. Click View Invoking Relationship to view the invoking relationship in a pop-up window.
Topology relationship
Topology relationship is one of the invoking relationships. It displays the relationship between applications, number of invoking times, and latency.
- Captured packet analysis: supports sampling packet capturing for requests and responses to locate problems during the test. A maximum of 100 requests and responses can be captured for each transaction at a time.
- On the SLA Report tab, check whether the SLA rules of the test task were triggered.
- Prerequisites
- Procedure