Viewing Doris Cluster Monitoring Information
Scenario
Cloud Eye monitors the running status of Doris clusters. You can view the monitoring metrics of Doris on the management console. According to the monitoring information, you can quickly learn about cluster health status and key system information.
Monitoring Function
The cluster monitoring function consists of FE and BE metric monitoring. You can adjust the time range of monitoring data in each module to view historical data at different time. You can also adjust the time granularity of monitoring data to view data in different dimensions. If you want to view monitoring data in real time, enable automatic refresh. The platform can automatically refresh monitoring graphs at intervals of 1 hour, 3 hours, 12 hours, 24 hours, and 7 days.
If you are interested in a metric graph, you can click the zoom-in button to view the graph or export the graph.
Viewing Doris Cluster Monitoring Information on the Cloud Eye Console
- Log in to the CloudTable management console.
- Select a region in the upper left corner.
- In the navigation tree on the left, click Cluster Management.
- In the cluster list, locate the row where the target cluster resides, click View Metric in the Operation column. The Cloud Eye console is displayed.
The status of the cluster to be viewed must be In service.
- On the Cloud Service Monitoring page, click
 on the left of the cluster ID to expand the compute unit list, and select the corresponding node to view the monitoring information.
- ID: ID of the monitored instance, that is, the CloudTable cluster ID
- Viewing monitoring metrics: Locate the compute unit you want to view and click View Metric.
- Set the metrics to be viewed if there are too many metrics on the monitoring page.
- If there are too many metrics, delete them on the Select Metric page.
- If the metrics displayed on the page do not contain the desired metrics, add the metrics on the Select Metric page.
- Select at least one metric. You can drag a selected metric and drop it to a desired location to sort the metrics.Note
- If you want to view monitoring data in real time, enable automatic refresh. The platform can automatically refresh monitoring graphs at intervals of 1 hour, 3 hours, 12 hours, 24 hours, and 7 days.
- If you want to zoom in on a single metric view, click
 in the upper right corner of the metric view to view its details.
Viewing Doris Cluster Monitoring Information on the Cluster Details Page
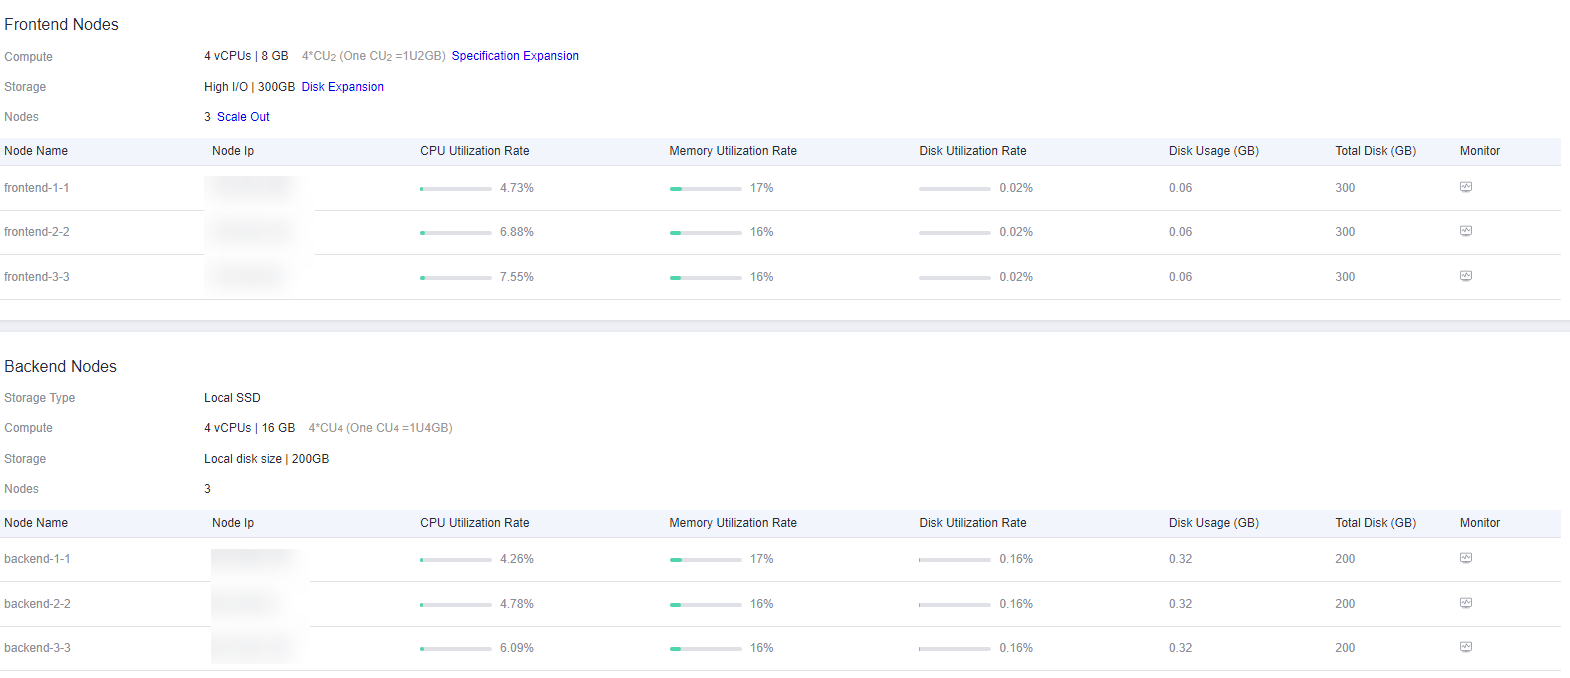
The cluster details page displays the CPU usage, memory usage, and disk usage of each Doris node.
- Log in to the CloudTable management console.
- Go to the Cluster Management page, select the target Doris cluster, and click the cluster name to go to the cluster details page.
- View the monitoring metrics on the cluster details page.
Figure 1 Viewing the monitoring metrics
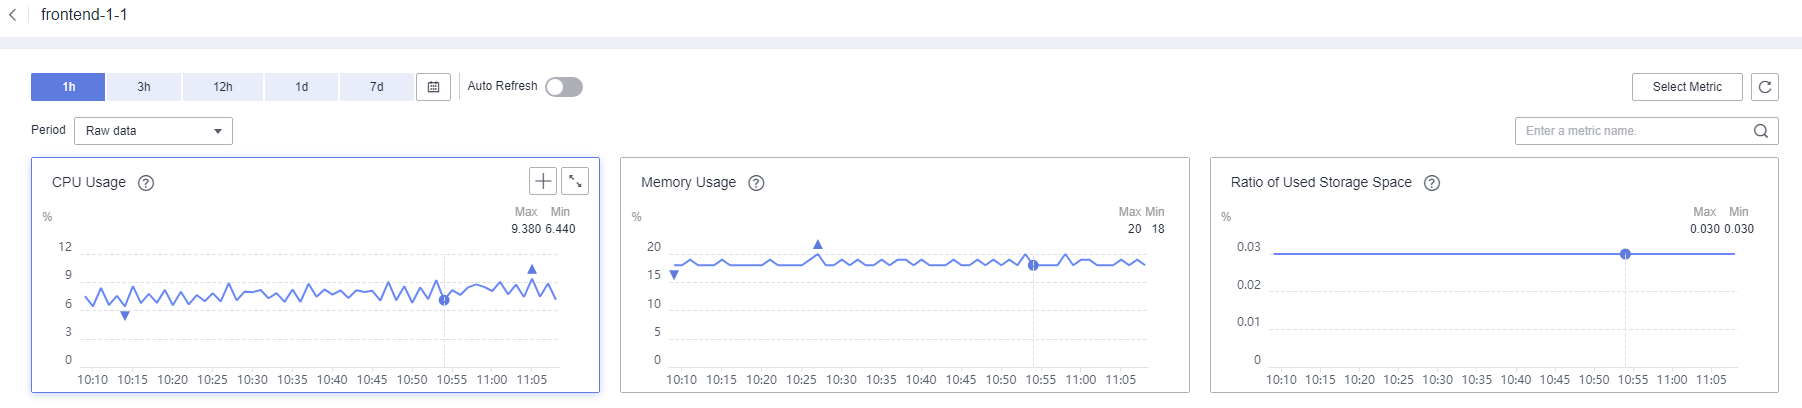
- To view all node metrics, navigate to the Cloud Eye monitoring page from the details page by clicking the monitoring icon
 . This page provides detailed monitoring metrics for individual Doris cluster nodes.
Figure 2 Monitoring metrics
- Scenario
- Monitoring Function
- Viewing Doris Cluster Monitoring Information on the Cloud Eye Console
- Viewing Doris Cluster Monitoring Information on the Cluster Details Page