CloudTable uses CTS to record operations associated with CloudTable for later query, audit, and backtrack operations. After you enable CTS, the system starts recording CloudTable operation logs. Operation records of the last 7 days can be viewed on the CTS management console.
The following key operation traces of CloudTable are recorded in audit logs. For details, see Table 1.
Operation | Trace Name | Resource Type |
|---|---|---|
Creating a cluster | createCloudTableClusterV3 | cluster |
Scaling out a node | growCloudTableCluster | cluster |
Restarting a cluster | rebootCloudTableCluster | cluster |
Setting the storage quota | storageClusterAction | cluster |
Modifying a feature | modifyClusterFeatures | cluster |
Creating a data migration task | copierCreateTask | cluster |
Enumerating database information | copierListDatabaseInfo | cluster |
Enumerating cluster node information | copierListNodeInfo | cluster |
Querying the migration task details | copierTaskDetail | cluster |
Creating a ClickHouse user | createCloudTableAccount | cluster |
Creating a role | createRole | cluster |
Deleting a cluster | deleteCloudTableClusterV2 | cluster |
Deleting a role | deleteRole | cluster |
Disabling cluster logs | disableLTSAccess | cluster |
Enabling cluster logs | enableLTSAccess | cluster |
Obtaining cluster information | getClusterInfo | cluster |
Obtaining database information | getDatabases | cluster |
Obtaining role information | getRoles | cluster |
Obtaining table information | getTables | cluster |
Accessing the disk expansion page | growCloudTableDisk | cluster |
Expanding specifications | growCloudTableFlavor | cluster |
Restarting a node | restartInstance | cluster |
Restart | REBOOTING | cluster |
Capacity expansion | GROWING | cluster |
Deletion | DELETING | cluster |
Enabling both secure and non-secure streams for ClickHouse | enableBothSslAndNone | cluster |
Scanning and killing SQL statements | killQueryBySqlId | cluster |
Deleting a ClickHouse user | deleteCloudTableAccount | cluster |
Updating a ClickHouse user | updateCloudTableAccount | cluster |
Enabling CTS
A tracker will be automatically created after CTS is enabled. All traces recorded by CTS are associated with a tracker. Currently, only one tracker can be created for each account.
- Log in to the CTS console.
- Enabling CTS
If you are a first-time CTS user and do not have any created tackers in the tracker list, enable CTS first. For details, see Getting Started > Overview in the Cloud Trace Service User Guide.
If you have enabled CTS, the system has automatically created a management tracker. Only one management tracker can be created and it cannot be deleted. You can also manually create a data tracker. For details, see Management Trackers > Creating a Tracker in the Cloud Trace Service User Guide.
Disabling the Audit Log Function
If you want to disable the audit log function, disable the tracker in CTS.
- Log in to the CTS console.
- Disable the audit log function by disabling the tracker. To enable the audit log function again, you only need to enable the tracker.
For details about how to enable or disable a tracker, see Management Trackers > Disabling or Enabling a Tracker in the Cloud Trace Service Getting Started.
Viewing CTS Logs of CloudTable
- Log in to the CTS console.
- In the navigation pane on the left, choose Trace List.
- In the upper right corner of the trace list, click Filter to set the search criteria.
The following four filter criteria are available:
- Trace Source, Resource Type, and Search By
- Trace Source: Select CloudTable.
- Resource Type: Select All resource types or specify a resource type.
- Search By: Select All or any of the following options:
- Trace name: If you select this option, you also need to select a specific trace name.
- Resource ID: If you select this option, you also need to select or enter a specific resource ID.
- Resource name: If you select this option, you also need to select or enter a specific resource name.
- Operator: Select a specific operator (at user level rather than tenant level).
- Trace Status: Available options include All trace statuses, normal, warning, and incident. You can only select one of them.
- Start Date and End Date: You can specify the time period to query traces.
- Trace Source, Resource Type, and Search By
- Click Query.
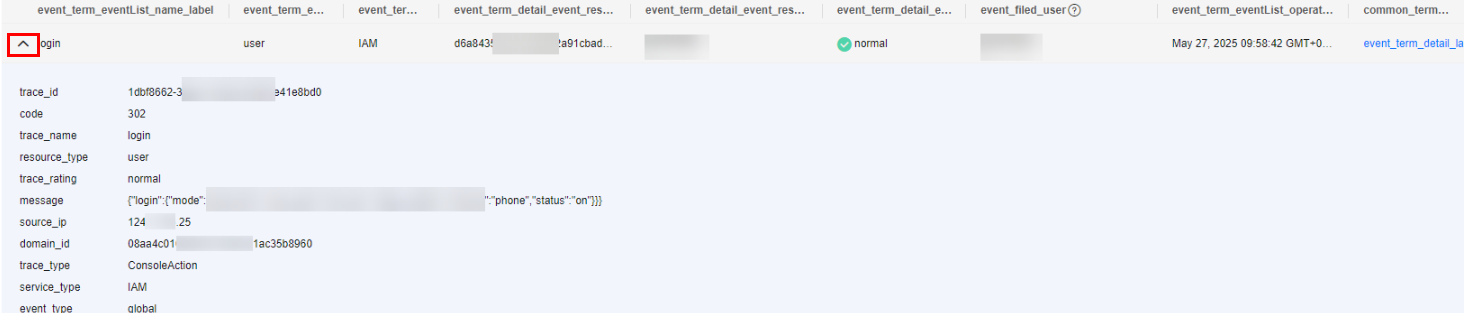
- Click
 on the left of the trace to be queried to extend its details.
Figure 1 Trace
- Locate the row containing the target trace and click View Trace in the Operation column.
Figure 2 Viewing a trace
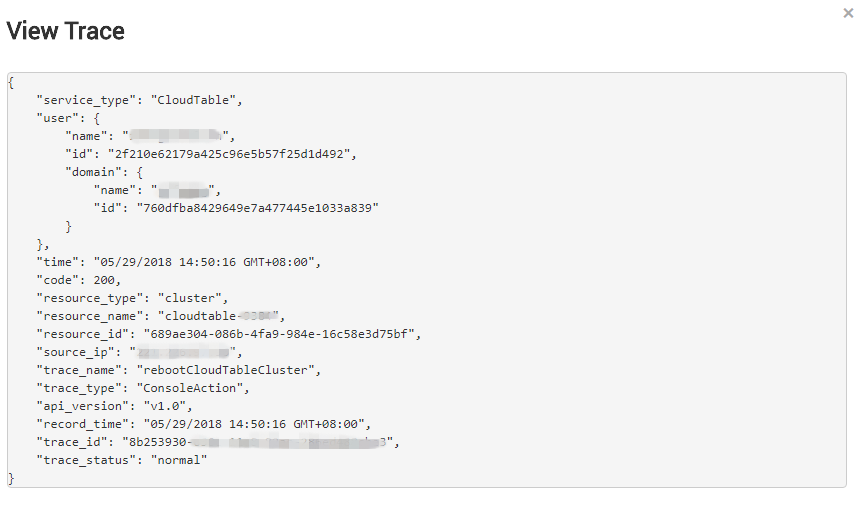
For details about key fields in the CTS trace structure, see the "Trace References" > "Trace Structure" in the Cloud Trace Service User Guide.