Viewing HBase Cluster Monitoring Information
Scenario
Cloud Eye monitors the operational status of the HBase cluster. You can view cluster monitoring metrics on the management console. According to the monitoring information, you can quickly learn about cluster health status and key system information.
Background Information
- Monitoring metrics of an unavailable cluster node cannot be displayed on the Cloud Eye page. You can view the monitoring information only after the CloudTable cluster node is restarted or recovered.
- Cloud Eye will delete a cluster node that becomes faulty for 1 hour from the monitoring list and will not monitor it anymore. However, you need to manually clear its alarm rules.
Viewing HBase Cluster Monitoring Information on the Cloud Eye Console
- Log in to the CloudTable management console.
- Select a region in the upper left corner.
- In the navigation tree on the left, click Cluster Management.
- In the cluster list, locate the row where the target cluster resides, click View Metric in the Operation column. The Cloud Eye console is displayed.
The status of the cluster to be viewed must be In service.
- On the Cloud Service Monitoring page, click
 on the left of the cluster ID to expand the compute unit list, and select the corresponding node to view the monitoring information.
- ID: ID of the monitored instance, that is, the CloudTable cluster ID
- Viewing monitoring metrics: Locate the compute unit you want to view and click View Metric.
- Set the metrics to be viewed if there are too many metrics on the monitoring page.
- If there are too many metrics, delete them on the Select Metric page.
- If the metrics displayed on the page do not contain the desired metrics, add the metrics on the Select Metric page.
- Select at least one metric. You can drag a selected metric and drop it to a desired location to sort the metrics.
Viewing HBase Cluster Monitoring Information on the Cluster Details Page
The cluster details page displays the CPU, memory, disk utilization rate, as well as the disk usage and total disk capacity of each HBase node.
- Log in to the CloudTable management console.
- Go to the Cluster Management page, select the target HBase cluster, and click the cluster name to go to the cluster details page.
- View the monitoring metrics on the cluster details page.
Figure 1 HBase monitoring page
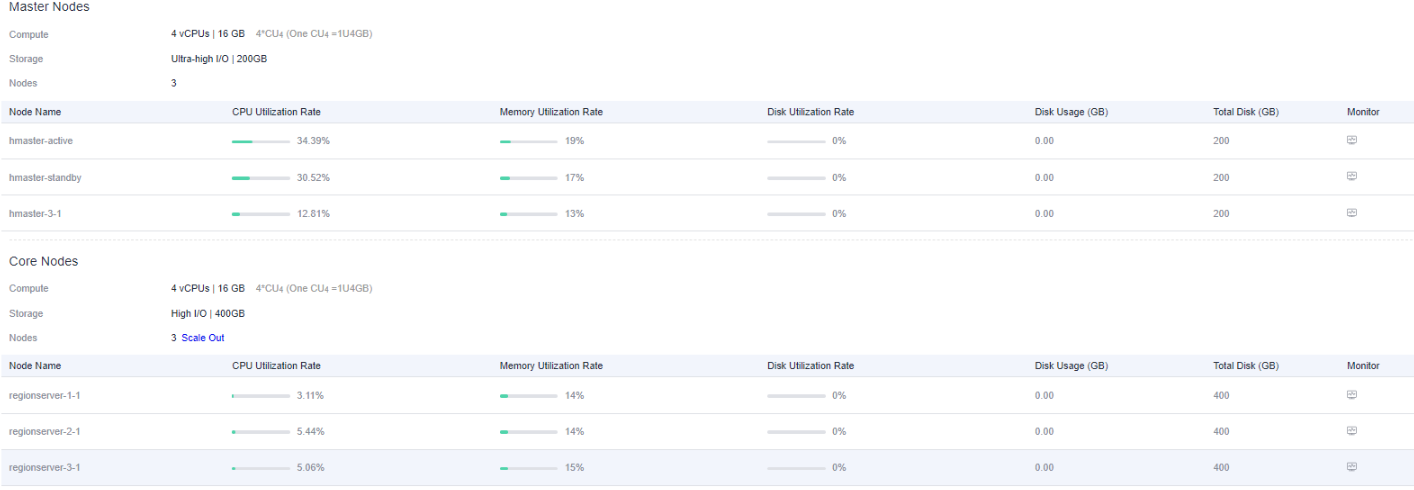
- To view all node metrics, navigate to the Cloud Eye monitoring page from the details page by clicking the monitoring icon
 . This page provides detailed monitoring metrics for individual HBase cluster nodes.
Parent topic: Using Cloud Eye to Monitor HBase Clusters
- Scenario
- Background Information
- Viewing HBase Cluster Monitoring Information on the Cloud Eye Console
- Viewing HBase Cluster Monitoring Information on the Cluster Details Page