Using HPA and CA for Auto Scaling of Workloads and Nodes
Application Scenarios
The best way to handle surging traffic is to automatically adjust the number of machines based on the traffic volume or resource usage, which is called scaling.
To prevent pods from using up node resources without limit during peak hours, it is a common practice to specify request and limit values for pods before deploying an application. However, this approach may encounter a resource bottleneck as an application exception may occur once the upper limit of resource usage is reached. To address this problem, you can scale the pods in or out to distribute the workload. If the node resource usage reaches its upper limit after pods are added and new pods cannot be scheduled, you can scale the nodes in or out depending on the node resource usage.
Solution
Two major auto scaling policies are HPA (Horizontal Pod Autoscaling) and CA (Cluster AutoScaling). HPA is for workload auto scaling and CA is for node auto scaling.
HPA and CA work with each other. HPA requires sufficient cluster resources for successful scaling. When the cluster resources are insufficient, CA is needed to add nodes. If HPA reduces workloads, the cluster will have a large number of idle resources. In this case, CA needs to release nodes to avoid resource waste.
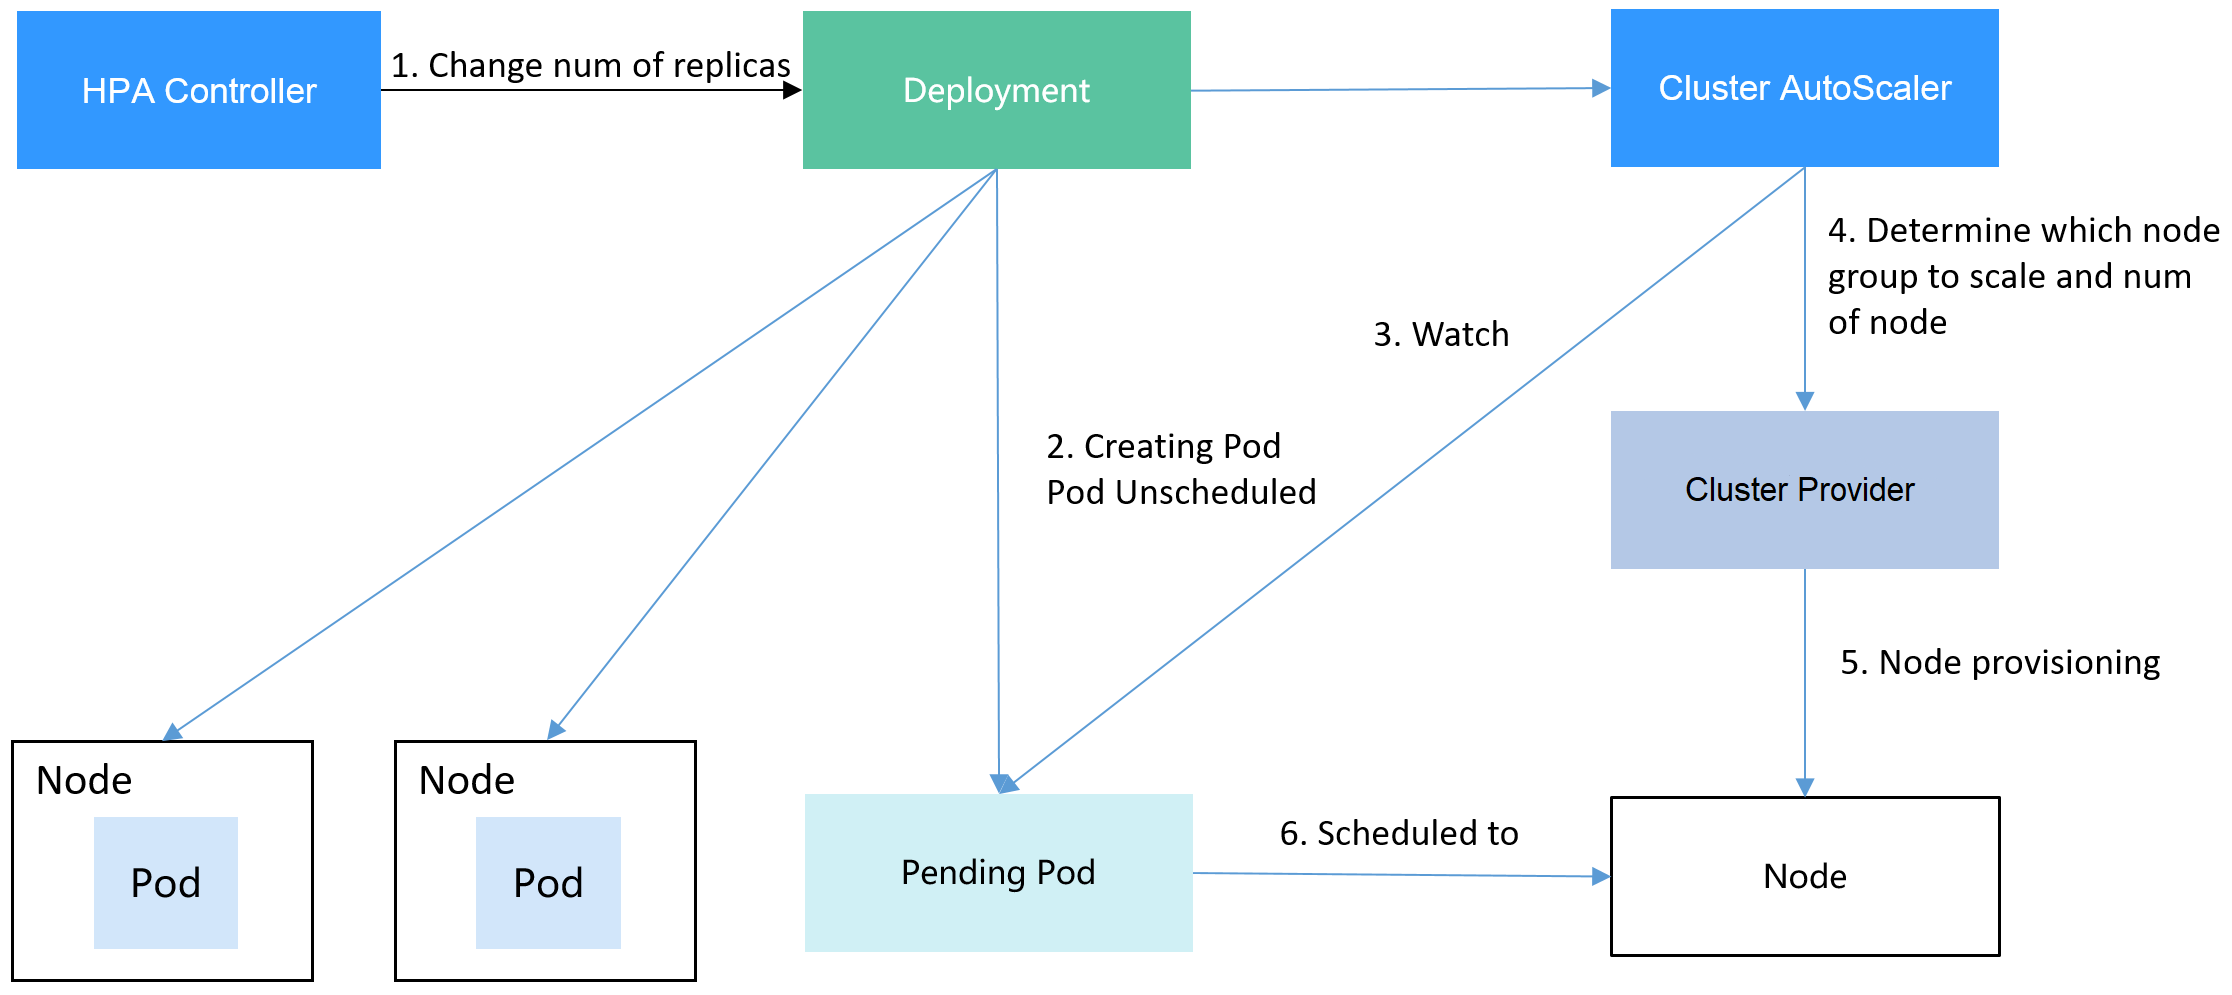
As shown in Figure 1, HPA performs scale-out based on the monitoring metrics. When cluster resources are insufficient, newly created pods are in Pending state. CA then checks these pending pods and selects the most appropriate node pool based on the configured scaling policy to scale out the node pool.
Figure 1 HPA and CA working flows
Using HPA and CA enables automatic scaling for most scenarios while also providing monitoring capabilities.
This section uses an example to describe the auto scaling process using HPA and CA policies together.
Preparations
- Create a cluster with one node. The node should have 2 cores of vCPUs and 4 GiB of memory, or a higher specification, as well as an EIP to allow external access. If no EIP is bound to the node during node creation, you can manually bind one on the ECS console after creating the node.
- Install add-ons for the cluster.
- autoscaler: node scaling add-on
- metrics-server: an aggregator of resource usage data in a Kubernetes cluster. It can collect measurement data of major Kubernetes resources, such as pods, nodes, containers, and Services.
- Log in to the cluster node and run a computing-intensive application. When a user sends a request, the result needs to be calculated before being returned to the user.
- Create a PHP file named index.php to calculate the square root of the request for 1,000,000 times before returning OK!.vi index.php
The file content is as follows:
<?php$x = 0.0001;for ($i = 0; $i <= 1000000; $i++) {$x += sqrt($x);}echo "OK!";?> - Compile a Dockerfile file to build an image.vi Dockerfile
The content is as follows:
FROM php:5-apacheCOPY index.php /var/www/html/index.phpRUN chmod a+rx index.php - Run the following command to build an image named hpa-example with the tag latest.docker build -t hpa-example:latest .
- (Optional) Log in to the SWR console, choose Organizations in the navigation pane, and click Create Organization in the upper right corner.
Skip this step if you already have an organization.
- In the navigation pane, choose My Images and then click Upload Through Client. On the page displayed, click Generate a temporary login command and click
 to copy the command.
 - Run the login command copied in the previous step on the cluster node. If the login is successful, the message "Login Succeeded" is displayed.
- Tag the hpa-example image.
docker tag {Image name 1:Tag 1}/{Image repository address}/{Organization name}/{Image name 2:Tag 2}
- {Image name 1:Tag 1}: name and tag of the local image to be uploaded.
- {Image repository address}: the domain name at the end of the login command in login command. It can be obtained on the SWR console.
- {Organization name}: name of the created organization.
- {Image name 2:Tag 2}: desired image name and tag to be displayed on the SWR console.
The following is an example:
docker tag hpa-example:latest swr.ru-moscow-1.hc.sbercloud.ru/group/hpa-example:latest
- Push the image to the image repository.
docker push {Image repository address}/{Organization name}/{Image name 2:Tag 2}
The following is an example:
docker push swr.ru-moscow-1.hc.sbercloud.ru/group/hpa-example:latest
The following information will be returned upon a successful push:
6d6b9812c8ae: Pushed...fe4c16cbf7a4: Pushedlatest: digest: sha256:eb7e3bbd*** size: **To view the pushed image, go to the SWR console and refresh the My Images page.
- Create a PHP file named index.php to calculate the square root of the request for 1,000,000 times before returning OK!.
Creating a Node Pool and a Node Scaling Policy
- Log in to the CCE console, access the created cluster, click Nodes on the left, click the Node Pools tab, and click Create Node Pool in the upper right corner.
- Configure the node pool.
- Node Type: Select a node type.
- Specifications: 2 vCPUs | 4 GiB
Retain the default values for other parameters.
- Locate the row containing the newly created node pool and click Auto Scaling in the upper right corner.
If the CCE Cluster Autoscaler add-on is not installed in the cluster, install it first.
- Customize scale-out rules.: Click Add Rule. In the dialog box displayed, configure parameters. If the CPU allocation rate is greater than 70%, a node is added to each associated node pool. A node scaling policy needs to be associated with a node pool. Multiple node pools can be associated. When you need to scale nodes, node with proper specifications will be added or reduced from the node pool based on the minimum waste principle.
- Nodes: Modify the node quantity range. The number of nodes in a node pool will always be within the range during auto scaling.
- Cooldown Period: a period during which the nodes added in the current node pool cannot be scaled in
- Specifications: Configure whether to enable auto scaling for node flavors in a node pool.
- Click OK.
Creating a Workload
Use the hpa-example image to create a Deployment with one replica. The image path is related to the organization uploaded to the SWR repository and needs to be replaced with the actual value.
kind: DeploymentapiVersion: apps/v1metadata:name: hpa-examplespec:replicas: 1selector:matchLabels:app: hpa-exampletemplate:metadata:labels:app: hpa-examplespec:containers:- name: container-1image: 'hpa-example:latest' # Replace it with the address of the image you uploaded to SWR.resources:limits: # The value of limits must be the same as that of requests to prevent flapping during scaling.cpu: 500mmemory: 200Mirequests:cpu: 500mmemory: 200MiimagePullSecrets:- name: default-secret
Then, create a NodePort Service for the workload so that the workload can be accessed from external networks.
kind: ServiceapiVersion: v1metadata:name: hpa-examplespec:ports:- name: cce-service-0protocol: TCPport: 80targetPort: 80nodePort: 31144selector:app: hpa-exampletype: NodePort
Creating an HPA Policy
Create an HPA policy. As shown below, the policy is associated with the hpa-example workload, and the target CPU usage is 50%.
There are two other annotations. One annotation defines the CPU thresholds, indicating that scaling is not performed when the CPU usage is between 30% and 70% to prevent impact caused by slight fluctuation. The other is the scaling time window, indicating that after the policy is successfully executed, a scaling operation will not be triggered again in this cooling interval to prevent impact caused by short-term fluctuation.
apiVersion: autoscaling/v2kind: HorizontalPodAutoscalermetadata:name: hpa-policyannotations:extendedhpa.metrics: '[{"type":"Resource","name":"cpu","targetType":"Utilization","targetRange":{"low":"30","high":"70"}}]'extendedhpa.option: '{"downscaleWindow":"5m","upscaleWindow":"3m"}'spec:scaleTargetRef:kind: Deploymentname: hpa-exampleapiVersion: apps/v1minReplicas: 1maxReplicas: 100metrics:- type: Resourceresource:name: cputarget:type: UtilizationaverageUtilization: 50
Observing the Auto Scaling Process
- Check the cluster node status. In the following example, there are two nodes.# kubectl get nodeNAME STATUS ROLES AGE VERSION192.168.0.183 Ready <none> 2m20s v1.17.9-r0-CCE21.1.1.3.B001-17.36.8192.168.0.26 Ready <none> 55m v1.17.9-r0-CCE21.1.1.3.B001-17.36.8
Check the HPA policy. The CPU usage of the target workload is 0%.
# kubectl get hpa hpa-policyNAME REFERENCE TARGETS MINPODS MAXPODS REPLICAS AGEhpa-policy Deployment/hpa-example 0%/50% 1 100 1 4m - Run the following command to access the workload. In the following command, {ip:port} indicates the access address of the workload, which can be queried on the workload details page.
while true;do wget -q -O- http://{ip:port}; done
NoteIf no EIP is displayed, the cluster node has not been assigned any EIP. Allocate one, bind it to the node, and synchronize node data.
Observe the scaling process of the workload.
# kubectl get hpa hpa-policy --watchNAME REFERENCE TARGETS MINPODS MAXPODS REPLICAS AGEhpa-policy Deployment/hpa-example 0%/50% 1 100 1 4mhpa-policy Deployment/hpa-example 190%/50% 1 100 1 4m23shpa-policy Deployment/hpa-example 190%/50% 1 100 4 4m31shpa-policy Deployment/hpa-example 200%/50% 1 100 4 5m16shpa-policy Deployment/hpa-example 200%/50% 1 100 4 6m16shpa-policy Deployment/hpa-example 85%/50% 1 100 4 7m16shpa-policy Deployment/hpa-example 81%/50% 1 100 4 8m16shpa-policy Deployment/hpa-example 81%/50% 1 100 7 8m31shpa-policy Deployment/hpa-example 57%/50% 1 100 7 9m16shpa-policy Deployment/hpa-example 51%/50% 1 100 7 10mhpa-policy Deployment/hpa-example 58%/50% 1 100 7 11mYou can see that the CPU usage of the workload is 190% at 4m23s, which exceeds the target value. In this case, scaling is triggered to expand the workload to four replicas/pods. In the subsequent several minutes, the CPU usage does not decrease until 7m16s. This is because the new pods may not be successfully created. The possible cause is that resources are insufficient and the pods are in the pending state. During this period, nodes are being scaled out.
At 7m16s, the CPU usage decreases, indicating that the pods are successfully created and start to bear traffic. The CPU usage decreases to 81% at 8m, still greater than the target value (50%) and the high threshold (70%). Therefore, 7 pods are added at 9m16s, and the CPU usage decreases to 51%, which is within the range of 30% to 70%. From then on, the number of pods remains 7.
In the following output, you can see the workload scaling process and the time when the HPA policy takes effect.
# kubectl describe deploy hpa-example...Events:Type Reason Age From Message---- ------ ---- ---- -------Normal ScalingReplicaSet 25m deployment-controller Scaled up replica set hpa-example-79dd795485 to 1Normal ScalingReplicaSet 20m deployment-controller Scaled up replica set hpa-example-79dd795485 to 4Normal ScalingReplicaSet 16m deployment-controller Scaled up replica set hpa-example-79dd795485 to 7# kubectl describe hpa hpa-policy...Events:Type Reason Age From Message---- ------ ---- ---- -------Normal SuccessfulRescale 20m horizontal-pod-autoscaler New size: 4; reason: cpu resource utilization (percentage of request) above targetNormal SuccessfulRescale 16m horizontal-pod-autoscaler New size: 7; reason: cpu resource utilization (percentage of request) above targetCheck the number of nodes. The following output shows that two nodes are added.
# kubectl get nodeNAME STATUS ROLES AGE VERSION192.168.0.120 Ready <none> 3m5s v1.17.9-r0-CCE21.1.1.3.B001-17.36.8192.168.0.136 Ready <none> 6m58s v1.17.9-r0-CCE21.1.1.3.B001-17.36.8192.168.0.183 Ready <none> 18m v1.17.9-r0-CCE21.1.1.3.B001-17.36.8192.168.0.26 Ready <none> 71m v1.17.9-r0-CCE21.1.1.3.B001-17.36.8You can also view the scaling history on the console. For example, the CA policy is executed once when the CPU allocation rate in the cluster is greater than 70%, and the number of nodes in the node pool is increased from 2 to 3. The new node is automatically added by autoscaler based on the pending state of pods in the initial phase of HPA.
The node scaling process is as follows:
- After the number of pods changes to 4, the pods are in Pending state due to insufficient resources. As a result, the default scale-out policy of the autoscaler add-on is triggered, and the number of nodes is increased by one.
- The second node scale-out is triggered because the CPU allocation rate in the cluster is greater than 70%. As a result, the number of nodes is increased by one, which is recorded in the scaling history on the console. Scaling based on the allocation rate ensures that the cluster has sufficient resources.
- Stop accessing the workload and check the number of pods.# kubectl get hpa hpa-policy --watchNAME REFERENCE TARGETS MINPODS MAXPODS REPLICAS AGEhpa-policy Deployment/hpa-example 50%/50% 1 100 7 12mhpa-policy Deployment/hpa-example 21%/50% 1 100 7 13mhpa-policy Deployment/hpa-example 0%/50% 1 100 7 14mhpa-policy Deployment/hpa-example 0%/50% 1 100 7 18mhpa-policy Deployment/hpa-example 0%/50% 1 100 3 18mhpa-policy Deployment/hpa-example 0%/50% 1 100 3 19mhpa-policy Deployment/hpa-example 0%/50% 1 100 3 19mhpa-policy Deployment/hpa-example 0%/50% 1 100 3 19mhpa-policy Deployment/hpa-example 0%/50% 1 100 3 19mhpa-policy Deployment/hpa-example 0%/50% 1 100 3 23mhpa-policy Deployment/hpa-example 0%/50% 1 100 3 23mhpa-policy Deployment/hpa-example 0%/50% 1 100 1 23m
You can see that the CPU usage is 21% at 13m. The number of pods is reduced to 3 at 18m, and then reduced to 1 at 23m.
In the following output, you can see the workload scaling process and the time when the HPA policy takes effect.
# kubectl describe deploy hpa-example...Events:Type Reason Age From Message---- ------ ---- ---- -------Normal ScalingReplicaSet 25m deployment-controller Scaled up replica set hpa-example-79dd795485 to 1Normal ScalingReplicaSet 20m deployment-controller Scaled up replica set hpa-example-79dd795485 to 4Normal ScalingReplicaSet 16m deployment-controller Scaled up replica set hpa-example-79dd795485 to 7Normal ScalingReplicaSet 6m28s deployment-controller Scaled down replica set hpa-example-79dd795485 to 3Normal ScalingReplicaSet 72s deployment-controller Scaled down replica set hpa-example-79dd795485 to 1# kubectl describe hpa hpa-policy...Events:Type Reason Age From Message---- ------ ---- ---- -------Normal SuccessfulRescale 20m horizontal-pod-autoscaler New size: 4; reason: cpu resource utilization (percentage of request) above targetNormal SuccessfulRescale 16m horizontal-pod-autoscaler New size: 7; reason: cpu resource utilization (percentage of request) above targetNormal SuccessfulRescale 6m45s horizontal-pod-autoscaler New size: 3; reason: All metrics below targetNormal SuccessfulRescale 90s horizontal-pod-autoscaler New size: 1; reason: All metrics below targetYou can also view the HPA policy execution history on the console. Wait until the one node is reduced.
The reason why the other two nodes in the node pool are not reduced is that they both have pods in the kube-system namespace, and these pods are not created by DaemonSets.
Summary
By using HPA and CA, auto scaling can be effortlessly implemented in various scenarios. Additionally, the scaling process of nodes and pods can be conveniently tracked.
- Application Scenarios
- Solution
- Preparations
- Creating a Node Pool and a Node Scaling Policy
- Creating a Workload
- Creating an HPA Policy
- Observing the Auto Scaling Process
- Summary