You can view the available capacity of a disk on the ECS. The operations are as follows:
- Log in to the server as user root.
For how to log in to an ECS, see the Elastic Cloud Server User Guide.
- Query the disk capacity. Two methods are provided as follows:
- View the disk usage manually.
The details depend on the OS. This FAQ uses Windows Server 2008, Windows Server 2016, and Linux as examples to describe how to view the disk usage.
- Install the Agent to view the disk usage.
For details about how to install the Agent on an ECS, see section "Installing the Agent" in the Cloud Eye User Guide.
- View the disk usage manually.
Viewing the Disk Usage in Linux
In this section, CentOS 7.4 64bit is used as an example. The details depend on if you need to view the available space or not.
- To query the total capacity only, run lsblk.
Information similar to the following is displayed:
[root@ecs-test-0001 ~]# lsblkNAME MAJ:MIN RM SIZE RO TYPE MOUNTPOINTvda 253:0 0 40G 0 disk└─vda1 253:1 0 40G 0 part /vdb 253:16 0 40G 0 disk└─vdb1 253:17 0 40G 0 partIn the command output, the server has two disks, /dev/vda and /dev/vdb. System disk /dev/vda has 40 GiB of capacity, as does data disk /dev/vdb.
- To query the total capacity and display the space available as well, run df -TH. Ensure that the disk has been attached and initialized before running this command.
Information similar to the following is displayed:
[root@ecs-0001 ~]# df -THFilesystem Type Size Used Avail Use% Mounted on/dev/vda1 ext4 43G 2.0G 39G 5% /devtmpfs devtmpfs 509M 0 509M 0% /devtmpfs tmpfs 520M 0 520M 0% /dev/shmtmpfs tmpfs 520M 7.2M 513M 2% /runtmpfs tmpfs 520M 0 520M 0% /sys/fs/cgrouptmpfs tmpfs 104M 0 104M 0% /run/user/0/dev/vdb1 ext4 43G 51M 40G 1% /mnt/sdcIn the command output, the server has two partitions, /dev/vda1 and /dev/vdb1. Partition /dev/vda1 is used to deploy the OS, and its total capacity, used capacity, and available capacity are 43 GiB, 2 GiB, and 39 GiB, respectively. Partition /dev/vdb1's total capacity, used capacity, and available capacity are 43 GiB, 51 MiB, and 40 GiB, respectively.
Viewing the Disk Usage in Windows Server 2008
In this section, Windows Server 2008 R2 Enterprise 64bit is used as an example.
- On the desktop of the server, right-click Computer and choose Manage from the shortcut menu.
The Server Manager window is displayed.
- In the navigation tree, choose Storage > Disk Management.
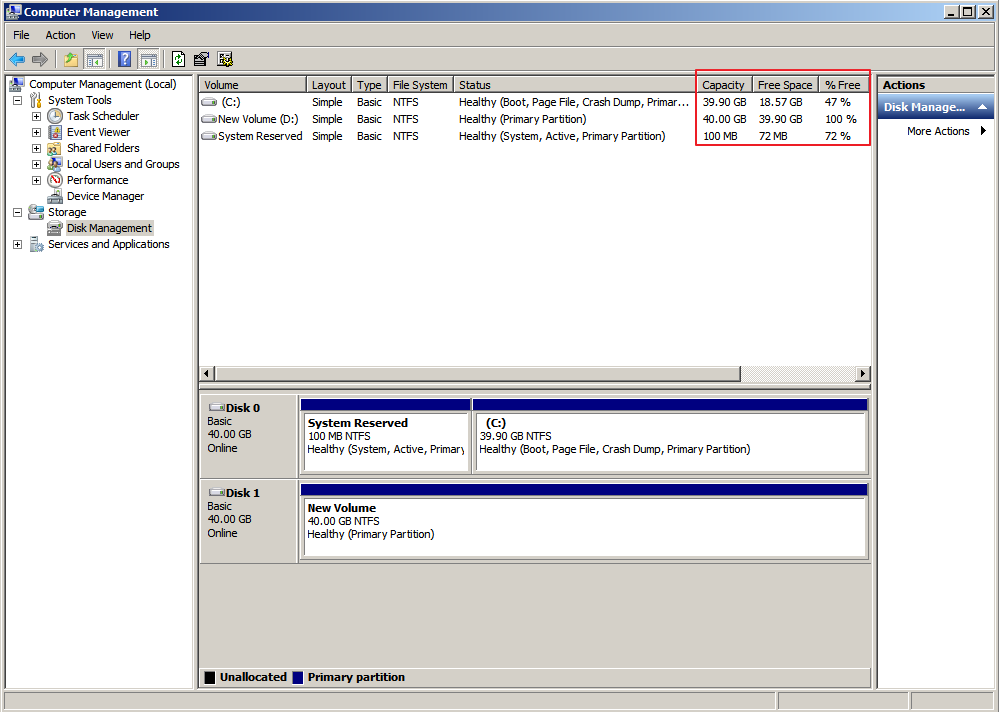
The sizes and available spaces of the volumes on the current disk are displayed in the middle pane.
Figure 1 Disk Management page
Viewing the Disk Usage in Windows Server 2016
In this section, Windows Server 2016 Standard 64bit is used as an example.
- On the desktop of the server, click the start icon in the lower left corner.
The Windows Server window is displayed.
- Click Server Manager.
The Server Manager window is displayed.
Figure 2 Server Manager page
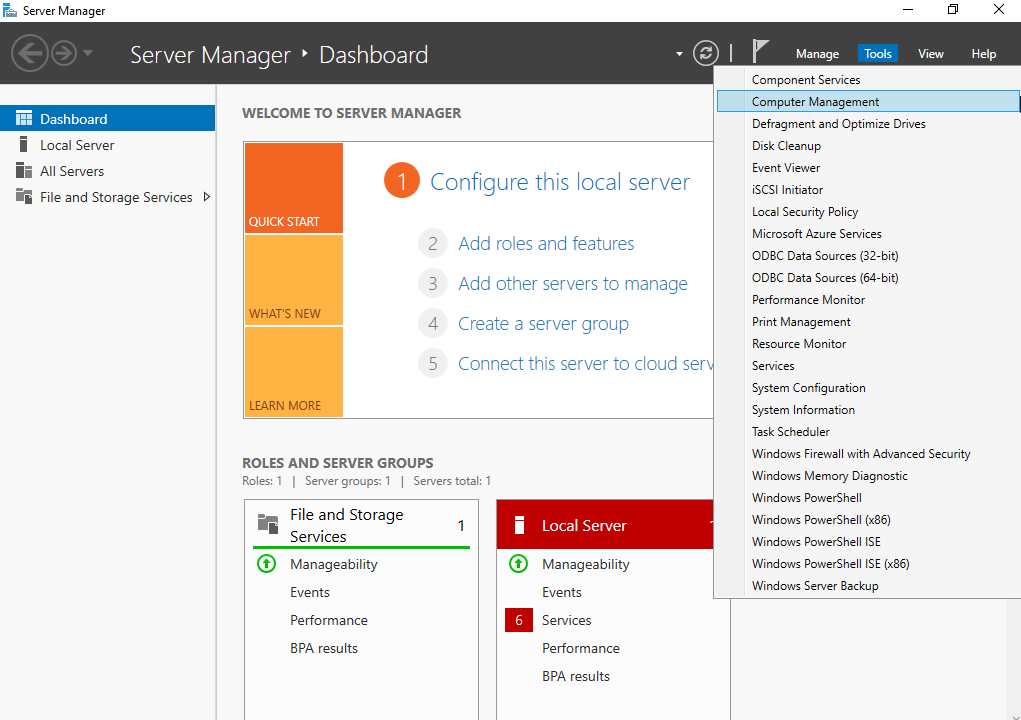
- In the upper right corner, choose Tools > Computer Management.
- Choose Storage > Disk Management.
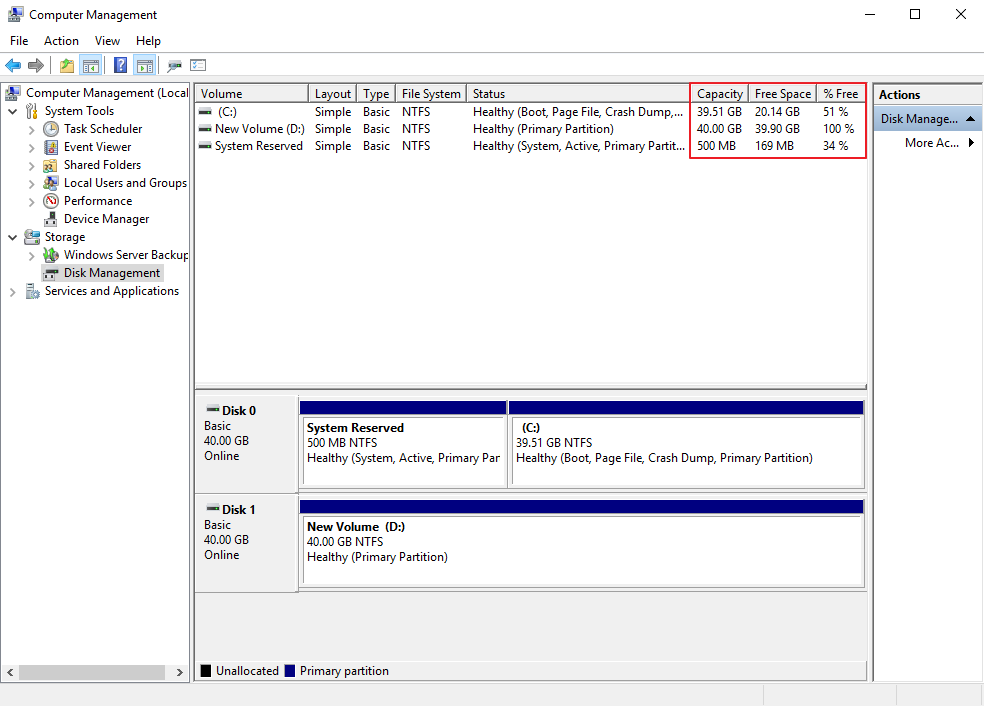
In the middle pane, you can view the sizes and available spaces of the volumes on the disk.
Figure 3 Disk list page
Installing the Agent to View the Disk Usage
Some disk monitoring metrics require that the agent to be installed.
For details about how to install the Agent on an ECS, see section "Installing the Agent" in the Cloud Eye User Guide.
Metric | Parameter | Description | Value Range | Unit | Conversion Rule | Monitored Object & Dimension | Monitoring Period (Raw Data) |
|---|---|---|---|---|---|---|---|
disk_free | (Agent) Available Disk Space | Free space on the disks
| ≥0 | GB | N/A | ECS - Mount point | 1 minute |
disk_total | (Agent) Disk Storage Capacity | Total space on the disks, including used and free
| ≥0 | GB | N/A | ECS - Mount point | 1 minute |
disk_used | (Agent) Used Disk Space | Used space on the disks
| ≥0 | GB | N/A | ECS - Mount point | 1 minute |
disk_usedPercent | (Agent) Disk Usage | Percentage of total disk space that is used, which is calculated as follows: Disk Usage = Used Disk Space/Disk Storage Capacity
| 0-100 | % | N/A | ECS - Mount point | 1 minute |