This section describes the configuration items of the industry distribution chart.
Fields
- In the Data area on the right, select a dataset, and double-click or drag required dimension and metric fields to the corresponding areas on the Fields tab.
- Set a filter.
- Find the data field you need in the dimension and metric lists within the data column.
- Click
 next to the field you wish to filter and you will be directed to the filter settings page.
 - Click OK.
Table 1 Filter parameters Type
Parameter
Description
string
Condition
Filter Mode: The options are Condition and Enumeration.
Condition Type: The options are And condition and Or condition.
Filter Condition: The options are Exact match, Contain, Start with, End with, Not match, Not contain, Null, and Not null.
Enumeration
Query Mode: The options are Single-select and multi-select.
Filter Condition: The options are >, ≥, <, ≤, =, ≠, Null, and Not null.
Metric
Condition Type
The options are And condition and Or condition.
Filter Condition
The options are >, ≥, <, ≤, =, ≠, Null, and Not null. You can select Before aggregation and After aggregation for data.
NOTE:If you select Before aggregation, data is filtered before aggregation. If you select After aggregation, data is filtered after aggregation. For aggregation concepts, see Creating a Dataset.
You can click Create Filter Condition to set multiple filter criteria.
Date
Range value
Select a time range for filtering.
Single value
Set a single time for filtering.
Condition
You can select And condition or Or condition as the condition type and select filter condition like >, ≥, <, ≤, and =.
You can click Create Filter Condition to set multiple filter criteria.
- Set the maximum number of query results.
Enter the maximum number of records that can be returned in the text box. The default value is 1000.
- Set automatic refresh.
The auto refresh interval supports the following options: no refresh, 1 minute, 5 minutes, 15 minutes, and 30 minutes.
Style
This section describes the style parameters of a funnel chart.
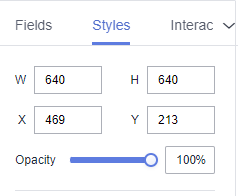
- Size/Position
- W: width of the target, in pixels.
- H: height of the target, in pixels.
- X: position where the target is located in the canvas. Unit: pixel.
- Y: position where the target is located in the canvas. Unit: pixel.
- Opacity: Adjust the transparency of the target on the canvas using a slider or by manually entering a percentage. A higher percentage means lower transparency.
Figure 1 Size/Position
- Circular ring
- Rings sum: The number of rings in the industry distribution chart. The value ranges from 1 to 3.
- Ring settings:
- Max. Card Num: The number of cards displayed on the ring. The value ranges from 0 to 100.
- The rotation direction can be clockwise or anticlockwise.
- Card Style
- Text: You can customize the color, font size, and font width of the text in the card.
- Icon: You can customize the color and icon type.
- Value Settings: You can set the context, units, scientific notation, use of thousand separators, and decimal places for numerical values.
- Animation: You can set the rotational speed and blinking duration of the industry distribution chart.
- Rotational Speed: Set a value from 0.1 to 2.
- Blinking Duration (s): Set a value from 1 to 10.