A Gantt chart is a tool used to display the project progress and timelines. It uses bar graphs to visually represent the start and end times of tasks, making it suitable for long-term and multi-phase project planning. With a Gantt chart, you can easily understand the overall structure of a project, monitor the task progress, and make timely adjustments to plans in response to changes.
This section will show you how to add data and configure styles for Gantt charts.
Notes and Constraints
- The dimension axis is determined by the dimensions of the data and only one dimension can be selected.
- Status/Dimension is optional, and other areas are mandatory.
Prerequisites
- A project has been created by referring to Creating a Project.
- A data source has been connected by referring to Creating a Data Source.
- A dataset has been created by referring to Creating a Dataset.
- A dashboard has been created by referring to Creating a Dashboard.
Procedure
- In the tool bar on the top, click Add Chart and select Gantt Chart to create a Gantt chart template.
- Select a dataset in the Data area.
- Set parameters on the Field, Style, and Advanced tabs.
- Click Update. The system automatically updates the chart.
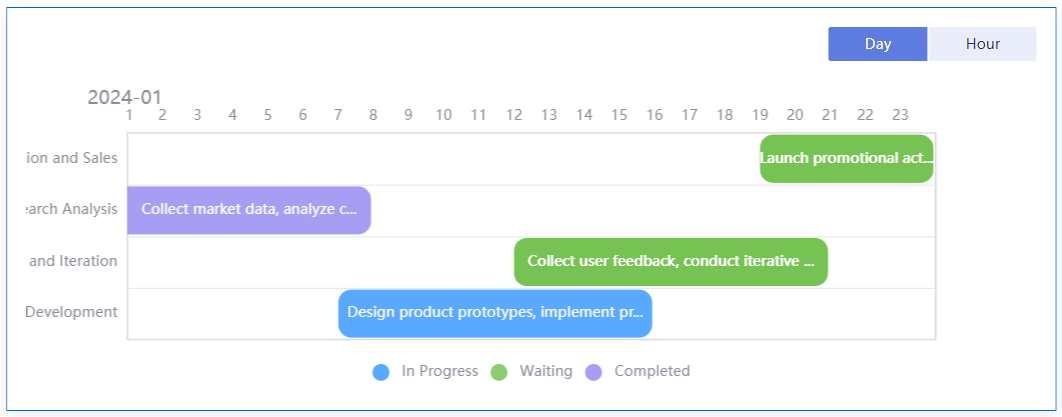
Figure 1 Gantt chart
- Click Save or Save and Publish in the upper right corner to save the chart.
Field
- In the Data area on the right, double-click or drag required dimension and metric fields.
- Set a filter.
- Drag dimension and metric fields to the Filter area.
- Click
 next to a field in the Filter area.
 - In the displayed Set Filter dialog box, set the parameters and click OK.
Table 1 Filter parameters Type
Parameter
Description
String
Condition
Filter Mode: The options are Condition and Enumeration.
Condition Type: The options are And condition and Or condition.
Filter Condition: The options are Exact match, Contain, Start with, End with, Not match, Not contain, Null, and Not null.
Enumeration
Query Mode: The options are Single-select and multi-select.
Filter Condition: The options are >, ≥, <, ≤, =, ≠, Null, and Not null.
Metric
Condition Type
The options are And condition and Or condition.
Filter Condition
The options are >, ≥, <, ≤, =, ≠, Null, and Not null. You can select Before aggregation and After aggregation for data.
NOTE:If you select Before aggregation, data is filtered before aggregation. If you select After aggregation, data is filtered after aggregation. For aggregation concepts, see Creating a Dataset.
You can click Create Filter Condition to set multiple filter criteria.
Date
Range value
Select a time range for filtering.
Single value
Set a single time for filtering.
Condition
You can select And condition or Or condition as the condition type and select filter condition like >, ≥, <, ≤, and =.
You can click Create Filter Condition to set multiple filter criteria.
- Set the maximum number of query results.
Enter the maximum number of records that can be returned in the text box. The default value is 1000.
- Set automatic refresh.
The auto refresh interval supports the following options: no refresh, 1 minute, 5 minutes, 15 minutes, and 30 minutes.
Style
Parameter | Description |
|---|---|
Card Title | Whether to display the card title. If selected, the card title is displayed in the upper left corner of the chart. |
Text | Set the text size and click |
Alignment | Set the alignment mode, which can be left alignment or center alignment. |
Bottom Margin | Set the distance between the card title and the chart. |
Divider | Whether to display the divider. You can set the size, color, and bottom margin of the divider. |
Card Background | Whether to display the card background. Click |
Status Icon | Whether to display the status icon. You can set the display mode and color of icons. The display modes include Always display and Hover display. |


Parameter | Description |
|---|---|
Visualization Style | Set the color of the Gantt chart by choosing from the system's preset color options or creating your own custom color scheme. |
Bar | Set the width and spacing of the bars in the Gantt chart. |
Coordinate Axis | X Axis
Y Axis
|
Legend | Set whether to display legends in your chart by adjusting their text size, color, position, and alignment. |
Label | Set whether to display data labels in your chart and customize their content, text size, and position. Select the desired field from the dropdown menu and the corresponding data will be displayed within the chart bars. |
Advanced
- Linkage
Click the Advanced tab and click
 next to Linkage. The Chart Linkage Settings page is displayed. Set parameters. For details, see Linkage example.
Table 4 Chart linkage configurations Parameter
Description
Filter
Select the fields to be bound first and then select the chart to be associated with them. You can select all charts on the dashboard.
Associated Charts
Link the associated charts.
- Follow bound field: When the bound field is set to A, the associated data tables filter data related to A.
- SQL placeholder: The bound field value corresponds to the value set for the SQL placeholder in the dataset.
- Initialize Query for Associated Query Control: whether the associated query control supports query initialization. If the checkbox is selected (
 ), the control supports query initialization. If the checkbox is not selected (
 ), the control does not support query initialization.Note
If you select this option, when a chart is linked to a query control and the query control does not have a default query set, the chart's data configuration will be queried during chart initialization.