This section describes the parameters for a dashboard.
Fields
- In the Data area on the right, select a dataset, and double-click or drag required dimension and metric fields to the corresponding areas on the Fields tab.
- Set a filter.
- Find the data field you need in the dimension and metric lists within the data column.
- Click
 next to the field you wish to filter and you will be directed to the filter settings page.
 - Click OK.
Table 1 Filter parameters Type
Parameter
Description
string
Condition
Filter Mode: The options are Condition and Enumeration.
Condition Type: The options are And condition and Or condition.
Filter Condition: The options are Exact match, Contain, Start with, End with, Not match, Not contain, Null, and Not null.
Enumeration
Query Mode: The options are Single-select and multi-select.
Filter Condition: The options are >, ≥, <, ≤, =, ≠, Null, and Not null.
Metric
Condition Type
The options are And condition and Or condition.
Filter Condition
The options are >, ≥, <, ≤, =, ≠, Null, and Not null. You can select Before aggregation and After aggregation for data.
NOTE:If you select Before aggregation, data is filtered before aggregation. If you select After aggregation, data is filtered after aggregation. For aggregation concepts, see Creating a Dataset.
You can click Create Filter Condition to set multiple filter criteria.
Date
Range value
Select a time range for filtering.
Single value
Set a single time for filtering.
Condition
You can select And condition or Or condition as the condition type and select filter condition like >, ≥, <, ≤, and =.
You can click Create Filter Condition to set multiple filter criteria.
- Set the maximum number of query results.
Enter the maximum number of records that can be returned in the text box. The default value is 1000.
- Set automatic refresh.
The auto refresh interval supports the following options: no refresh, 1 minute, 5 minutes, 15 minutes, and 30 minutes.
Style
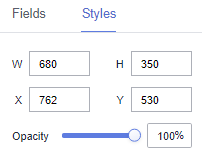
- Size/Position
- W: width of the target, in pixels.
- H: height of the target, in pixels.
- X: position where the target is located in the canvas. Unit: pixel.
- Y: position where the target is located in the canvas. Unit: pixel.
- Opacity: Adjust the transparency of the target on the canvas using a slider or by manually entering a percentage. A higher percentage means lower transparency.
Figure 1 Size/Position
- Global Style
- Font: font size of the dashboard.
- Dashboard Size: size of the dashboard.
- Divisions: scale of the dashboard.
- Title
- Title: title of the dashboard.
- Font Size: font size of the title.
- Font Width: font width of the title.
- Color: custom title color.
- Axis Color: color and range of the axis.
- Axis Attribute
- Coordinate Axis: width of the axis.
- Axis Scale: length, width, and color of the axis scale.
- Divider: length, width, and color of the divider.
- Axis Label: size, font size, font width, color, and position of the axis label.
- Pointer: pointer attributes. You can select whether to display the pointer on the dashboard. If the pointer is displayed, you can set the pointer length, width, and color.
- Value Labels
- Converting numeric to %: You can customize the value conversion.
- Unit/Font Size/Font Width/Color: You can customize the unit, font size, font width, and color.
- Position: custom position. The horizontal and vertical positions range from -100 to 100.