As data grows exponentially, traditional monolithic storage architectures struggle to balance performance and cost efficiency. To support high-speed real-time queries while lowering the cost of storing massive quantities of data, CSS offers the storage-compute decoupling feature for Elasticsearch clusters.
With decoupled storage and compute, hot data that is frequently accessed is stored in high-performance storage media, while cold data that is infrequently accessed is migrated to low-cost storage media—Object Storage Service (OBS). This ensures real-time query performance for hot data while reducing long-term storage costs.
How the Feature Works
Figure 1 Decoupled storage and compute architecture
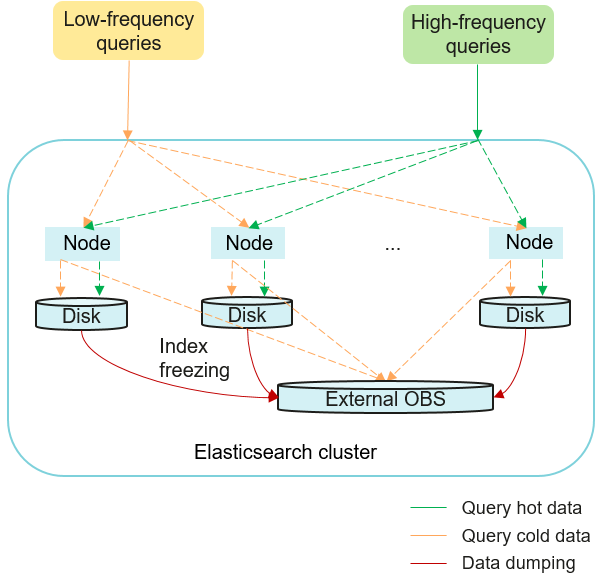
This is how storage-compute decoupling works:
- Data writing
Hot data is written to high-performance local disks (SSDs) to ensure real-time query performance.
- Hot-to-cold transition
Infrequently accessed data is migrated from SSDs to cost-effective OBS (OBS buckets are invisible to users), turning it from hot data to cold data. You can call the index freezing API to manually turn hot data to cold data, or define a lifecycle policy (for example, a 90-day data retention period) to have it triggered automatically. Cold data itself is stored in OBS for cost efficiency, but its metadata and date fields are maintained on local disks to enable rapid search.
- Query processing
- Hot data is read directly from local disks with millisecond latency.
- For cold data, the system uses metadata retained on local disks to quickly locate it in OBS, load it, and return it to the user.
In CSS, indexes may go through the following stages during their entire lifecycle.
Decoupled storage and compute can be automated via index lifecycle management policies. For details, see Decoupling Storage and Compute Using ISM.
Impact on Billing
Upon freezing, indexes are dumped to OBS, and the storage class is Standard. OBS buckets that store frozen indexes are invisible to users—users cannot view or manage them on the OBS console. Note that storing indexes in OBS buckets incurs additional fees, billed on a pay-per-use basis according to consumption of Standard storage capacity.
Constraints
- Only Elasticsearch 7.6.2 and 7.10.2 clusters support decoupled storage and compute.
- While an index is being frozen, the system sets the index to the read-only state. Even after the data in the index is dumped to OBS, the index remains read-only and no data can be written into the index.
- During index freezing, the data in it can still be queried. After the freezing is complete, the index is closed and then re-opened. During this transition period, the cluster may be in the red state temporarily, and the index becomes unsearchable. The index becomes searchable again after being re-opened.
- After an index is frozen, its data is dumped to an OBS bucket, and any index data is deleted from local disks. A frozen index has an increased query latency. During an aggregation operation, the latency becomes even longer because the query is complex and a large amount of data needs to be retrieved.
- A frozen index with data already dumped to OBS cannot be unfrozen. That is, a read-only index cannot be rolled back to writable.
- In the case of two clusters configured with read/write splitting, the secondary cluster cannot set storage-compute decoupling for indexes synchronized from the primary cluster.
- Vector indexes do not support storage-compute decoupling.
- When an index is frozen, its data is dumped to an OBS bucket. This process will consume network bandwidth. Make sure data transmission between your cluster and OBS does not exhaust the maximum bandwidth and QPS supported by OBS. If these constraints are violated, the performance of queries that involve OBS will deteriorate. For example, the speed of restoring shards and querying data will be slow.
Logging In to Kibana
Log in to Kibana and go to the command execution page. Elasticsearch clusters support multiple access methods. This topic uses Kibana as an example to describe the operation procedures.
- Log in to the CSS management console.
- In the navigation pane on the left, choose Clusters > Elasticsearch.
- In the cluster list, find the target cluster, and click Kibana in the Operation column to log in to the Kibana console.
- In the left navigation pane, choose Dev Tools.
The left part of the console is the command input box, and the triangle icon in its upper-right corner is the execution button. The right part shows the execution result.
Freezing an Index
Freezing an index means to move cold data from solid state drives (SSDs) to OBS, freeing up SSD storage for hot, frequently accessed data. A frozen index becomes read-only.
- Freeze an index.
Run the following command to dump the data of a specified index to OBS and set its storage class to Standard:
POST {index_name}/_freeze_low_costTable 1 Parameter description Parameter
Type
Default Value
Description
index_name
String
N/A
Specifies one or more indexes.
- Single index: Enter the index name, for example, my_index.
- Multiple indexes: Enter multiple index names and use a comma (,) to separate them, for example, my_index1,my_index2.
- Wildcard: Use the wildcard (*) to match multiple indexes. For example, myindex* indicates all indexes whose name starts with myindex.
Example response:
{"freeze_uuid": "pdsRgUtSTymVDWR_HoTGFw" // ID of the index freezing task, which you can use to query the task progress.}CautionIf the Elasticsearch cluster version is 7.10.2 and the image version is 7.10.2_25.9.0_xxx or later, index freezing tasks are not executed immediately upon submission. Instead, they are temporarily cached for a configurable period (default: one minute) and then processed in batches. The caching rules for asynchronous index freezing tasks can be customized. For details, see Modify batch index freezing settings.
- Check the progress of the index freezing task.
Run the following command to check the index freezing progress by specifying the task ID:
GET _freeze_low_cost_progress/{freeze_uuid}If the Elasticsearch cluster version is 7.10.2 and the image version is 7.10.2_25.9.0_xxx or later, the progresses of multiple index freezing tasks of the same batch are returned.
Example response:
{"stage" : "STARTED","shards_stats" : {"INIT" : 0,"FAILURE" : 0,"DONE" : 0,"STARTED" : 1,"ABORTED" : 0},"indices" : {"data1" : [{"uuid" : "7OS-G1-tRke2jHZPlckexg","index" : {"name" : "data1","index_id" : "4b5PHXJITLaS6AurImfQ9A","shard" : 2},"start_ms" : 1611972010852,"end_ms" : -1,"total_time" : "10.5s","total_time_in_millis" : 10505,"stage" : "STARTED","failure" : null,"size" : {"total_bytes" : 3211446689,"finished_bytes" : 222491269,"percent" : "6.0%"},"file" : {"total_files" : 271,"finished_files" : 12,"percent" : "4.0%"},"rate_limit" : {"paused_times" : 1,"paused_nanos" : 946460970}}]}}Table 2 Response parameters Parameter
Description
stage
Status of the index freezing task.
Value range:
- INIT: The task has just started or is being initialized.
- FAILURE: failed
- DONE: complete
- STARTED: started
- ABORTED: canceled. This field is reserved.
shards_stats
Number of shards in each state.
indices
Status details of each index, as described in Table 3.
Table 3 indices parameters Parameter
Description
uuid
ID of the index freezing task.
index
Index and shard information.
start_ms
Task start time.
end_ms
Task end time. If the task is still ongoing, -1 is displayed.
total_time
How long the task has been ongoing.
total_time_in_millis
How long the task has been ongoing, in milliseconds.
stage
Shard status.
failure
Task failure cause. If no failure has occurred, null is returned.
size.total_bytes
Total bytes to be frozen.
size.finished_bytes
Number of bytes that have been frozen.
size.percent
Freezing progress in terms of bytes that have been frozen vs total bytes to freeze.
file.total_bytes
Total number of documents to be frozen.
file.finished_bytes
Number of documents that have been frozen.
file.percent
Freezing progress in terms of the number of documents that have been frozen vs. total number of documents to freeze.
rate_limit.paused_times
Number of times freezing has been suspended due to rate limiting.
rate_limit.paused_nanos
Duration of freezing task suspension due to rate limiting, in nanoseconds.
When index freezing is complete, the settings parameters will be returned, as described in Table 4.
Table 4 settings parameters Parameter
Description
index.frozen_low_cost
Frozen index. The value is fixed to true.
index.blocks.write
Writes disallowed to a frozen index. The value is fixed to true.
index.store.type
Index storage type. The value is fixed to obs.
- Query the list of frozen indexes.Note
Here, only some of the key parameters for querying the frozen index list are described. For more information about the API, see cat indices API.
Run the following command to query the frozen index list based on index freezing status:
GET _cat/freeze_indices?stage={STAGE}Table 5 Parameter description Parameter
Type
Default Value
Description
STAGE
String
N/A
Index freezing stage.
Value range:
- start: Freezing has started and is ongoing.
- done: Freezing has completed.
- unfreeze: Freezing has not started.
- Empty or any other value: Freezing is ongoing or has completed.
Example response:
green open data2 0bNtxWDtRbOSkS4JYaUgMQ 3 0 5 0 7.9kb 7.9kbgreen open data3 oYMLvw31QnyasqUNuyP6RA 3 0 51 0 23.5kb 23.5kb
Optimizing Cache Settings for Frozen Indexes
After an index is frozen, its data is dumped to OBS. To reduce direct data retrieval from OBS and thus improve query performance, some data is cached in the cluster. Data that is requested for the first time is directly retrieved from OBS. The retrieved data is then cached in the cluster memory. In response to subsequent queries, the system searches the cache first. CSS allows you to query cache statistics for frozen indexes that are stored in OBS buckets. You can also reset the cache status and modify cache configuration.
- Query cache statistics for frozen indexes stored in OBS buckets.
- Run the following command to query cache statistics for frozen indexes on all nodes:GET _frozen_stats
- Run the following command to query cache statistics for frozen indexes on specified nodes:GET _frozen_stats/{node_id}
Table 6 Parameter description Parameter
Type
Default Value
Description
node_id
String
N/A
Specifies one or more cluster nodes.
- Single node: Enter the node ID.
- Multiple nodes: Enter multiple node IDs and use a comma (,) to separate them.
You can run the following command to obtain node IDs:
GET _cat/nodes?s=n&h=n,id&v=true&full_id=true
The following is an example of the returned information for querying frozen index cache statistics on all nodes:
{"_nodes" : {"total" : 1, // Total number of nodes"successful" : 1, // Successful nodes"failed" : 0 // Failed nodes},"cluster_name" : "css-zzz1", //Cluster name"nodes" : {"7uwKO38RRoaON37YsXhCYw" : {"name" : "css-zzz1-ess-esn-2-1", //Node name"transport_address" : "10.0.0.247:9300", //Node transport address"host" : "10.0.0.247", //Node host"ip" : "10.0.0.247", //Node IP address"block_cache" : {"default" : {"type" : "memory", //Cache type. memory indicates in-memory cache."block_cache_capacity" : 8192, //Cache capacity"block_cache_blocksize" : 8192, //Single block size in the cache, in bytes. In the example, the block size is 8 KB."block_cache_size" : 12, //Cache capacity used"block_cache_hit" : 14, //Number of cache hits"block_cache_miss" : 0, //Number of cache misses"block_cache_eviction" : 0, //Number of cache evictions"block_cache_store_fail" : 0 //Number of cache storage failures, which occur when the cache is full.}},"obs_stats" : {"list" : {"obs_list_count" : 17, //Number of times the OBS list API was called."obs_list_ms" : 265, //Total length of time spent calling the OBS list API."obs_list_avg_ms" : 15 //Average time spent calling the OBS list API.},"get_meta" : {"obs_get_meta_count" : 79, //Number of times the OBS get metadata API was called."obs_get_meta_ms" : 183, //Total length of time spent calling the OBS get metadata API."obs_get_meta_avg_ms" : 2 //Average time spent calling the OBS get metadata API.},"get_obj" : {"obs_get_obj_count" : 12, //Number of times the OBS get object API was called."obs_get_obj_ms" : 123, //Total length of time spent calling the OBS get object API."obs_get_obj_avg_ms" : 10 //Average time spent calling the OBS get object API.},"put_obj" : {"obs_put_obj_count" : 12, //Number of times the OBS put object API was called."obs_put_obj_ms" : 2451, //Total length of time spent calling the OBS put object API."obs_put_obj_avg_ms" : 204 //Average time spent calling the OBS put object API.},"obs_op_total" : {"obs_op_total_ms" : 3022, //Total length of time spent calling OBS APIs."obs_op_total_count" : 120, //Total number of times calling OBS APIs."obs_op_avg_ms" : 25 //Average time spent calling OBS APIs.}},"reader_cache" : {"hit_count" : 0,"miss_count" : 1,"load_success_count" : 1,"load_exception_count" : 0,"total_load_time" : 291194714,"eviction_count" : 0}}}} - Run the following command to query cache statistics for frozen indexes on all nodes:
- Reset the cache status for frozen indexes stored in OBS buckets.
Run the following command to reset the cache status for frozen indexes:
POST _frozen_stats/resetThis command is used to debug performance issues. If you reset the cache status and then run the cache query command, you can check the accurate cache command status. It is not advisable to use this command during runtime.
Example response:
{"_nodes" : {"total" : 1,"successful" : 1,"failed" : 0},"cluster_name" : "Es-0325-007_01","nodes" : {"mqTdk2YRSPyOSXfesREFSg" : {"result" : "ok"}}} - Modify cache configuration for frozen indexes.
Elasticsearch accesses different types of files using different methods. The cache system supports multi-level caches and uses blocks of different sizes to cache different types of files. For example, typically, a large number of small blocks are used to cache .fdx and .tip files, while a small number of large blocks are used to cache .fdt files. You can modify the cache configuration based on service needs. Table 7 describes the parameters that can be configured.
Table 7 Configuring cache settings for frozen indexes Parameter
Type
Default Value
Description
low_cost.obs.blockcache.names
Array
["default"]
A list of the names of multi-level caches. The cache system supports multi-level caches for data of different access granularities.
There is a default cache named default. If you configure this parameter, the value must include at least the default cache in addition to other custom cache names.
low_cost.obs.blockcache.<NAME>.type
ENUM
memory
Storage type of the cache named <NAME>.
Value range:
- memory: The cache uses in-memory storage, which means it consumes memory resources.
- file: The cache uses disk storage. Its capacity is limited by available disk space. In this case, you are advised to use ultra-high I/O disks to improve cache performance.
low_cost.obs.blockcache.<NAME>.blockshift
Integer
13 (indicating 8 KB)
Block size in the cache named <NAME> (in bytes).
Formula: 2blockshift. For example, if the value is 16, the block size is 216 bytes, that is, 65536 bytes or 64 KB.
Value: number of left-shifts
low_cost.obs.blockcache.<NAME>.bank.count
Integer
1
Number of partitions in the cache named <NAME>. Each partition is an independent unit in the cache.
low_cost.obs.blockcache.<NAME>.number.blocks.perbank
Integer
8192
Number of blocks in each partition of the cache named <NAME>.
low_cost.obs.blockcache.<NAME>.exclude.file.types
Array
N/A
List of file name extensions for files that cannot be cached in the cache named <NAME>.
If a file's extension is not in exclude.file.types or <NAME>.file.types (if configured), the default cache policy applies.
low_cost.obs.blockcache.<NAME>.file.types
Array
N/A
List of file name extensions for files that can be cached in the cache named <NAME>.
If a file's extension is not in exclude.file.types or <NAME>.file.types (if configured), the default cache policy applies.
index.frozen.obs.max_bytes_per_sec
String
150MB
Maximum rate at which the documents of frozen indexes are uploaded to OBS.
Value format: number + unit
- Number: a natural number
- Unit: B, K, KB, M, MB, G, GB, T, TB, P, or PB (case-insensitive)
Value range: 0 to (263 – 1) bytes
The value 0 indicates no limit.
The change takes effect immediately.
low_cost.obs.index.upload.threshold.use.multipart
String
1GB
Multipart upload threshold. In the process of dumping frozen indexes to OBS, if the size of a single document exceeds this threshold, a multipart upload is performed.
Value format: number + unit
- Number: a natural number
- Unit: B, K, KB, M, MB, G, GB, T, TB, P, or PB (case-insensitive)
Value range: 0 to (263 – 1) bytes
The value 0 indicates there is no multipart upload.
The following is a typical cache configuration example. A two-level cache system is used: default and large. The default cache has a total of 30 x 4096 64-KB blocks. It is used to cache non-.fdt files. The large cache has 5 x 1000 2-MB blocks. It is used to cache .fdx, .dvd, and .tip files.
low_cost.obs.blockcache.names: ["default", "large"]low_cost.obs.blockcache.default.type: filelow_cost.obs.blockcache.default.blockshift: 16low_cost.obs.blockcache.default.number.blocks.perbank: 4096low_cost.obs.blockcache.default.bank.count: 30low_cost.obs.blockcache.default.exclude.file.types: ["fdt"]low_cost.obs.blockcache.large.type: filelow_cost.obs.blockcache.large.blockshift: 21low_cost.obs.blockcache.large.number.blocks.perbank: 1000low_cost.obs.blockcache.large.bank.count: 5low_cost.obs.blockcache.large.file.types: ["fdx", "dvd", "tip"] - Modify batch index freezing settings.
If the Elasticsearch cluster version is 7.10.2 and the image version is 7.10.2_25.9.0_xxx or later, index freezing tasks are not executed immediately upon submission. Instead, they are temporarily cached for a configurable period and then processed in batches. The caching rules for asynchronous index freezing tasks can be customized. Table 8 describes relevant parameters.
Table 8 Parameters for configuring batch index freezing Parameter
Type
Default Value
Description
low_cost.freeze.job.interval
TimeValue
1m
Batch index freezing task execution interval.
Value range: 10s to 10m
If this parameter is set to 1m, the system caches index freezing requests for 1 minute and then executes them all at once.
low_cost.freeze.job.batch_size
Integer
20
The maximum number of indexes that can be included in a single batch index freezing task.
Value range: 1 to 100
If this parameter is set to 20, each batch can contain 20 indexes. For example, if an Index Lifecycle Management (ILM) task submits 100 indexes for freezing at once, they will be divided into five batches and frozen one batch at a time.
low_cost.freeze.job.start_time
String
00:00 (executable all day)
Start time for batch index freezing tasks, meaning no such tasks can be started before the specified time. If a submitted index freezing task has not yet started, it will have to wait until the specified start time.
Value format: hour:minute
low_cost.freeze.job.end_time
String
23:59 (executable all day)
Start end time for batch index freezing tasks, meaning no such tasks can be started after the specified time. Ongoing tasks are not affected by this setting.
Value format: hour:minute
For example, run the following command to modify the default batch index freezing settings:
PUT _cluster/settings{"persistent": {"low_cost.freeze.job.interval": "5m","low_cost.freeze.job.batch_size": 30,"low_cost.freeze.job.start_time": "22:00","low_cost.freeze.job.end_time": "07:00"}}
Improving Query Performance for Frozen Indexes
Only Elasticsearch 7.6.2 and 7.10.2 clusters created after February 2023 support this feature.
When frozen indexes are queried on the Discover page of Kibana for the first time, all data needs to be retrieved from OBS because there is no data in the cache. If a large number of documents need to be returned, it takes a long time to retrieve the corresponding time fields and document metadata from OBS. By caching this part of data in the cluster, query performance can be improved significantly. This is how CSS improves query performance for frozen indexes. Local cache settings are preset. You can review them and modify them as needed.
- Modify local cache settings for frozen indexes. Table 9 describes these settings. All of them can be modified dynamically, and the changes take effect immediately.
Table 9 Local cache settings Parameter
Type
Default Value
Description
low_cost.local_cache.max.capacity
Integer
500
Maximum number of cold data caches that can be made available on each node. (Each shard corresponds to a cache.)
Value range: 10–5000
- If the heap memory usage remains high, decrease this value.
- If the value of load_overflow_count keeps increasing rapidly, increase this value.
index.low_cost.local_cache.threshold
Integer
50
The percentage of date fields in an index as a threshold for enabling or disabling the local caching of cold data.
- If in an index, the percentage of date fields is lower than this value, cold data of the date type will be cached locally. Otherwise, such data will not be cached.
- If date fields account for the vast majority of the total data size of the current index, you should not cache its data locally.
Value range: 0–100
Unit: %
index.low_cost.local_cache.evict_time
String
30d
Retention duration of cold data in the local cache. The value is determined by index.frozen_date (time of index freezing). If index.frozen_date is unavailable, the value is determined by the index creation time.
You are advised to adjust the retention duration based on your disk usage.
Value range: 1 to 365 days
Unit: d (days)
The following provides some examples:
- Run the following command to change the maximum number of cold data caches that can be made available on each node:PUT _cluster/settings{"persistent": {"low_cost.local_cache.max.capacity": 1000}}
- Run the following command to change the threshold (in the form of the percentage of date fields in an index) for enabling or disabling the local caching of date fields as cold data:PUT {index_name}/_settings{"index.low_cost.local_cache.threshold": 20}
- Run the following command to change the retention duration of cold data in the local cache:PUT {index_name}/_settings{"index.low_cost.local_cache.evict_time": "7d"}
- Query local cache statistics for frozen indexes.
- Query local cache statistics for frozen indexes on all nodes:GET /_frozen_stats/local_cache
- Query local cache statistics for frozen indexes on specified nodes:GET /_frozen_stats/local_cache/{node_id}
Example response:
{"_nodes" : {"total" : 1,"successful" : 1,"failed" : 0},"cluster_name" : "test","nodes" : {"6by3lPy1R3m55Dcq3liK8Q" : {"name" : "node-1","transport_address" : "127.0.0.1:9300","host" : "127.0.0.1","ip" : "127.0.0.1","local_cache" : {"get_stats" : {"get_total_count" : 562, //Total number of times data was retrieved from the local cold data cache."get_hit_count" : 562, //Total number of hits in the local cold data cache."get_miss_count" : 0, //Total number of local cold data cache misses."get_total_ns" : 43849200, //Total duration for retrieving data from the local cold data cache."get_avg_ns" : 78023 //Average duration for retrieving data from the local cold data cache.},"load_stats" : {"load_count" : 2, //Number of times cold data was loaded from the local cache"load_total_ms" : 29, //Total duration for loading cold data from the local cache"load_avg_ms" : 14, //Average duration for loading cold data from the local cache"load_fail_count" : 0, //Number of failures for loading cold data from the local cache"load_overflow_count" : 0 //Number of times the local cold data cache exceeds the cache pool size.},"reload_stats" : {"reload_count" : 0, //Number of times the local cold data cache was regenerated."reload_total_ms" : 0, //Total duration for regenerating the local cold data cache."reload_avg_ms" : 0, //Average duration for regenerating the local cold data cache."reload_fail_count" : 0 //Number of failures in regenerating the local cold data cache.},"init_stats" : {"init_count" : 0, //Number of times the local cold data cache was initialized."init_total_ms" : 0, //Total duration for initializing the local cold data cache."init_avg_ms" : 0, //Average duration for initializing the local cold data cache."init_fail_count" : 0 //Number of failures in initializing the local cold data cache.}}}}} - Query local cache statistics for frozen indexes on all nodes:
Querying the Real-Time Rates of OBS in Handling Cold Data
Only Elasticsearch 7.6.2 and 7.10.2 clusters created after February 2023 support this feature.
To help you understand how the storage-compute decoupling plug-in is working with OBS, an API for collecting statistics on the real-time rates of OBS has been added, and the real-time rates are recorded in the index .freeze_obs_rate-YYYY.mm.dd.
Calculation method: The average OBS operation rates in the last 5 seconds are calculated every 5 seconds.
The system index .freeze_obs_rate-YYYY.mm.dd records statistics on OBS real-time operation rates, helping you understand relevant trends about the OBS resources that store cold data. The default retention period of this index is 30 days.
- Querying the real-time rates of OBS in handling cold data.
- Run the following command to query the real-time OBS rates on all nodes:GET _frozen_stats/obs_rate
- Run the following command to query the real-time OBS rates on specified nodes:GET _frozen_stats/obs_rate/{node_id}
Example response:
{"_nodes" : {"total" : 1,"successful" : 1,"failed" : 0},"cluster_name" : "test","nodes" : {"dflDvcSwTJ-fkiIlT2zE3A" : {"name" : "node-1","transport_address" : "127.0.0.1:9300","host" : "127.0.0.1","ip" : "127.0.0.1","update_time" : 1671777600482, // Time when the current statistics were updated."obs_rate" : {"list_op_rate" : 0.0, // Rate of OBS list operations. Unit: times/s."get_meta_op_rate" : 0.0, // Rate of OBS get meta operations. Unit: times/s."get_obj_op_rate" : 0.0, // Rate of OBS get operations. Unit: times/s."put_op_rate" : 0.0, // Rate of OBS put operations. Unit: times/s."obs_total_op_rate" : 0.0, // Rate of all OBS operations. Unit: times/s."obs_upload_rate" : "0.0 MB/s", // OBS data upload rate. Unit: MB/s."obs_download_rate" : "0.0 MB/s" // OBS data download rate. Unit: MB/s.}}}} - Run the following command to query the real-time OBS rates on all nodes:
- Modify the retention period of the .freeze_obs_rate-YYYY.mm.dd index that stores the OBS real-time rates. The default retention period of this index is 30 days.
Run the following command to change the index retention period to seven days:
PUT _cluster/settings{"persistent": {"low_cost.obs_rate_index.evict_time": "7d"}}Table 10 Parameter description Parameter
Type
Default Value
Description
low_cost.obs_rate_index.evict_time
String
30d
The retention period of the .freeze_obs_rate-YYYY.mm.dd index on each node.
- Value range: 1 to 365 days
- Unit: d (days)
Any change takes effect immediately.
Related Documents
To ensure acceptable performance for cold data queries (for example, when historical data is queried periodically), use a tiered storage solution. For details, see Switching Between Hot and Cold Data.