Enterprises typically generate large volumes of service logs (in JSON or CSV formats), often distributed across local servers or third-party cloud platforms. For centralized search and real-time analytics, you may choose to aggregate such data into CSS OpenSearch clusters. However, for security reasons, CSS clusters are frequently deployed within private networks (for example, VPCs), which restrict direct ingestion from external data sources. This topic describes how to use open-source Logstash to securely and efficiently ingest data into CSS clusters in both private and public network environments.
Solution
Logstash is an open-source, server-side data processing pipeline that ingests data from multiple sources simultaneously, processes and transforms the data, and then sends it to CSS clusters. For more information about Logstash, see the official document Getting started with Logstash.
Depending on where the Logstash server is deployed, this solution can use either of the following network architectures:
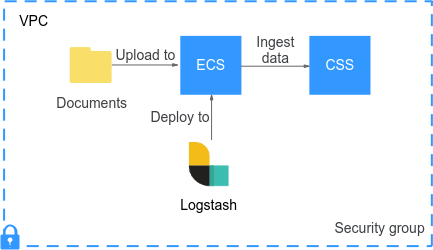
- Network architecture 1: Direct connection within a VPC (recommended)
Logstash is deployed on an ECS that is in the same VPC as the destination CSS cluster.
Characteristics: fast, easy to set up, and secure.
Figure 1 Logstash and CSS within the same VPC
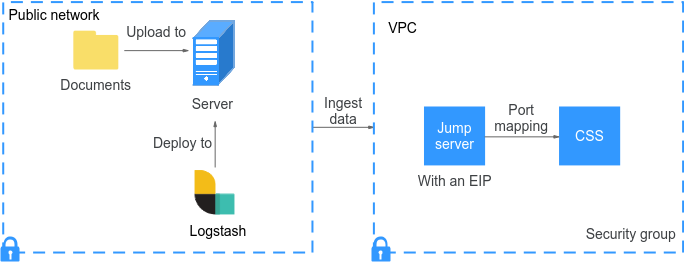
- Network architecture 2: SSH connection over the public network
Logstash is deployed in an on-premises data center or on a server located on the public network, which prevents it from directly accessing the destination CSS cluster in a private network. To connect the two, we need to use an ECS allocated with a public IP address as a jump server. This jump server leverages SSH port forwarding to forward traffic coming from Logstash to the destination cluster on the cloud.
Characteristics: suitable for migrating on-premises data to the cloud; port forwarding must be configured.
Figure 2 Logstash deployed on premises or in the public network
Prerequisites
- The server that deploys Logstash has JDK 1.8 or later installed. A Linux server is recommended.
- You have downloaded the OSS version (pure open-source) of Logstash. Logstash OSS 7.10.2 is recommended.
Download Logstash OSS at https://www.elastic.co/downloads/past-releases?product=logstash-oss.
- You have obtained the connection information for both the data source and destination, including IP addresses, port numbers, accounts, and passwords.
- The source data is ready for ingestion.
For example, the access_20181029.log is already in the /tmp/access_log/ directory on the Logstash server. The following is an example of the data:
| All | Heap used for segments | | 18.6403 | MB || All | Heap used for doc values | | 0.119289 | MB || All | Heap used for terms | | 17.4095 | MB || All | Heap used for norms | | 0.0767822 | MB || All | Heap used for points | | 0.225246 | MB || All | Heap used for stored fields | | 0.809448 | MB || All | Segment count | | 101 | || All | Min Throughput | index-append | 66232.6 | docs/s || All | Median Throughput | index-append | 66735.3 | docs/s || All | Max Throughput | index-append | 67745.6 | docs/s || All | 50th percentile latency | index-append | 510.261 | ms |
Scenario 1: Ingesting Data When Logstash and CSS Reside in the Same VPC
- Prepare the network: Make sure the ECS that hosts Logstash and the destination CSS cluster are within the same VPC, and that the VPC's security group allows port 9200.
Ping the CSS cluster's private network address from the ECS where you plan to deploy Logstash. If successful, the two are connected.
- Install Logstash on the ECS. The following provides an installation guide for Red Hat Linux. For other operating systems, see Installing Logstash.
- Use yum to install the JDK first. This is because Logstash depends on Java.yum install java # Replace it with the actual JDK version.
- Upload the downloaded Logstash package to the ECS.
- Use yum to install Logstash.yum install logstash-oss-7.10.0-x86_64.rpm
Replace logstash-oss-7.10.0-x86_64.rpm with the actual Logstash installation package name.
- Modify the JVM configuration of Logstash to accelerate cluster data migration.
The default heap memory of Logstash is 1 GB. You are advised to change it to half the cluster node memory.
vim /etc/logstash/jvm.options-Xms4g-Xmx4g
- Use yum to install the JDK first. This is because Logstash depends on Java.
- (Optional) Prepare the security certificate. If the security mode and HTTPS are enabled for the destination CSS cluster, you must upload the cluster's security certificate to the ECS.
- Obtaining the Security Certificate.
- Upload the downloaded security certificate to the ECS.
- Create a configuration file in the Logstash installation directory.
- Create a configuration file, for example, logstash-simple.conf.cd /logstash-x.x/ # Go to the Logstash installation directory.vi logstash-simple.conf # Create a configuration file.
- Define input, filter, and output in the configuration file.input {# Read local log files.file {path => "/tmp/access_log/*.log" # Path to the log filesstart_position => "beginning" # Start position for reading data}}filter {# Add data filtering logic here, such as grok and mutate.}output {elasticsearch {# Enter the cluster's private network address. For a multi-cluster node, enter multiple addresses to allow for load balancing.hosts => ["192.168.xxx.xxx:9200", "192.168.xxx.xxx:9200"]# Name of the index that events are written to.index => "my_import_index"# Configure the following for a security-mode cluster. (Delete them if security mode is disabled.)# user => "username" # CSS cluster account# password => "password" # CSS cluster password# ssl => true # Whether SSL is enabled# ssl_certificate_verification => false # Whether to enable certificate authentication# cacert => "/logstash/config/CloudSearchService.cer" # Absolute path to the security certificate# Commonly configured parameters to mitigate compatibility issuesilm_enabled => false # Disable index lifecycle management to prevent permission errors.manage_template => false # Disable template management.}}
- After the configuration is complete, enter :wq to save the configuration file.
- Create a configuration file, for example, logstash-simple.conf.
- Execute the configuration file to ingest data into the CSS cluster../bin/logstash -f logstash-simple.conf # Replace the file name with the actual configuration file name.
If a message similar to Successfully started Logstash API endpoint is returned and no error is reported, the task is running properly.
- After ingestion, verify data integrity.
- Log in to the CSS management console.
- In the navigation pane on the left, choose Clusters > OpenSearch.
- In the cluster list, find the target cluster, and click Dashboards in the Operation column to log in to OpenSearch Dashboards.
- In the left navigation pane, choose Dev Tools.
The left part of the console is the command input box, and the triangle icon in its upper-right corner is the execution button. The right part shows the execution result.
- Run the following command to check the newly ingested data:GET my_import_index/_count # Check the number of records ingested.GET my_import_index/_search # Check the content of the ingested data.
If the results are consistent with the source, data ingestion is successful.
Scenario 2: Ingesting Data When Logstash Is Deployed on the Public Network
- Prepare a jump server. In the VPC where the CSS cluster is located, prepare a Linux ECS allocated with an EIP, and configure security group rules to allow a local port (for example, 9100).
- Establish an SSH tunnel.
- On the jump server, run the following command to configure port mapping, which redirects requests sent to the opened port on the jump server to the destination cluster:ssh -g -L <Local port on the jump server>:<Private IP address of a CSS cluster node>:9200 -N -f root@<The jump server's private network address>
For example, if the opened local port (allowed by security group rules) on the jump server is 9100, the CSS cluster node's private IP address is 192.168.0.81, and the jump server's private IP address is 192.168.0.227, the port mapping command is as follows:
ssh -g -L 9100:192.168.0.81:9200 -N -f root@192.168.0.227NoteIf the specified CSS cluster node is unavailable, the port mapping command will fail. If the cluster contains multiple nodes, replace <Private IP address of a CSS cluster node> with the IP address of another node. If the cluster contains only one node, you have to wait until the node recovers.
For more information about SSH tunneling, see SSH official documents.
- Verify connectivity.curl http://<The jump server's public IP address>:<The jump server's local port>
If the OpenSearch version information is returned, the tunnel is established. When you configure the Logstash configuration file later, set hosts to <The jump server's public IP address>:<The jump server's local port>.
- On the jump server, run the following command to configure port mapping, which redirects requests sent to the opened port on the jump server to the destination cluster:
- (Optional) Install Logstash on a server deployed on an external network. The following provides an installation guide for Red Hat Linux.
- Use yum to install the JDK first. This is because Logstash depends on Java.yum install java # Replace it with the actual JDK version.
- Upload the downloaded Logstash package to the ECS.
- Use yum to install Logstash.yum install logstash-oss-7.10.0-x86_64.rpm
Replace logstash-oss-7.10.0-x86_64.rpm with the actual Logstash installation package name.
- Modify the JVM configuration of Logstash to accelerate cluster data migration.
The default heap memory of Logstash is 1 GB. You are advised to change it to half the cluster node memory.
vim /etc/logstash/jvm.options-Xms4g-Xmx4g
- Use yum to install the JDK first. This is because Logstash depends on Java.
- (Optional) Prepare the security certificate. If the security mode and HTTPS are enabled for the destination CSS cluster, you must upload the cluster's security certificate to the ECS.
- Obtaining the Security Certificate.
- Upload the downloaded security certificate to the ECS.
- Create a configuration file in the Logstash installation directory.
- Create a configuration file, for example, logstash-simple.conf.cd /logstash-x.x/ # Go to the Logstash installation directory.vi logstash-simple.conf # Create a configuration file.
- Define input, filter, and output in the configuration file.input {# Read local log files.file {path => "/tmp/access_log/*.log" # Path to the log filesstart_position => "beginning" # Start position for reading data}}filter {# Add data filtering logic here, such as grok and mutate.}output {elasticsearch {# Enter the local address for the SSH tunnel.hosts => ["<The jump server's public IP address>:<The jump server's local port>"]# Name of the index that events are written to.index => "my_import_index"# Configure the following for a security-mode cluster. (Delete them if security mode is disabled.)# user => "username" # CSS cluster account# password => "password" # CSS cluster password# ssl => true # Whether SSL is enabled# ssl_certificate_verification => false # Whether to enable certificate authentication# cacert => "/logstash/config/CloudSearchService.cer" # Absolute path to the security certificate# Commonly configured parameters to mitigate compatibility issuesilm_enabled => false # Disable index lifecycle management to prevent permission errors.manage_template => false # Disable template management.}}
- After the configuration is complete, enter :wq to save the configuration file.
- Create a configuration file, for example, logstash-simple.conf.
- Execute the configuration file to ingest data into the CSS cluster../bin/logstash -f logstash-simple.conf # Replace the file name with the actual configuration file name.
If a message similar to Successfully started Logstash API endpoint is returned and no error is reported, the task is running properly.
- After ingestion, verify data integrity.
- Log in to the CSS management console.
- In the navigation pane on the left, choose Clusters > OpenSearch.
- In the cluster list, find the target cluster, and click Dashboards in the Operation column to log in to OpenSearch Dashboards.
- In the left navigation pane, choose Dev Tools.
The left part of the console is the command input box, and the triangle icon in its upper-right corner is the execution button. The right part shows the execution result.
- Run the following command to check the newly ingested data:GET my_import_index/_count # Check the number of records ingested.GET my_import_index/_search # Check the content of the ingested data.
If the results are consistent with the source, data ingestion is successful.
Obtaining the Security Certificate
To access a security-mode OpenSearch cluster that uses HTTPS, perform the following steps to obtain the security certificate CloudSearchService.cer if it is required.
- Log in to the CSS management console.
- In the navigation pane on the left, choose Clusters > OpenSearch.
- In the cluster list, click the name of the target cluster. The cluster information page is displayed.
- Click the Overview tab. In the Network Information area, click Download Certificate below HTTPS Access.