When the calls between enterprise microservices are complex, APM Agents sample some requests, and intercept corresponding requests and subsequent call information. For example, in the scenario where service A calls service B and then calls service C, after service A receives a request, APM determines whether to trace the request based on the intelligent sampling algorithm.
Intelligent Sampling Algorithm
APM uses the intelligent sampling algorithm to determine whether to trace requests.
- If a request needs to be traced, a trace ID is generated and details (events) about some important methods (generally the tree structure with the parent-child relationship) under service A are intercepted. At the same time, the trace ID is transparently transmitted to service B. The important methods under service B are also intercepted. The trace ID is also transparently transmitted to service C. Some methods under service C are intercepted in a similar way as those under services B and A. Each node respectively reports event information and an association relationship can be formed based on the trace ID. In this way, you can view the call details of the entire request based on the trace ID.
- If a request does not need to be traced, no trace ID is generated. Service B does not receive the trace ID and uses the same algorithm as service A to determine whether to perform tracing.
- After data is reported, APM stores not only all event details, but also the root event (called span) information of each service for subsequent trace search. Generally, you search for the span information and then obtain the overall trace details based on the trace ID in the span information.
- By default, the intelligent sampling policy is used. There are three types of URLs: error URLs, slow URLs (use the default 800 ms or customize a threshold), and normal URLs. The sampling ratio of each type of URL is calculated separately. For APM, statistics are collected and reported every minute. In the first collection period, all URLs are regarded as normal for sampling. In the second collection period, URLs are classified into error, slow, and normal URLs based on the statistics collected in the previous period.
- Sampling rate of error URLs: If the CPU usage is less than 30%, 100 records are collected per minute. If the CPU usage is greater than or equal to 30% but less than 60%, 50 records are collected per minute. If the CPU usage is greater than or equal to 60%, 10 records are collected per minute. At least two records are collected for each URL.
- Sampling rate of slow URLs: If the CPU usage is less than 30%, 100 records are collected per minute. If the CPU usage is greater than or equal to 30% but less than 60%, 50 records are collected per minute. If the CPU usage is greater than or equal to 60%, 10 records are collected per minute. At least two records are collected for each URL.
- Sampling rate of normal URLs: If the CPU usage is less than 30%, 20 records are collected per minute. If the CPU usage is greater than or equal to 30% but less than 60%, 10 records are collected per minute. If the CPU usage is greater than or equal to 60%, 5 records are collected per minute. At least one record is collected for each URL.
The advantage of the preceding algorithm is that once the trace information is generated, the link is complete, helping you make correct decisions. If a large number of URLs are called, abnormal requests may fail to be collected. In this case, you can collect metrics to locate system exceptions.
Trace Search
This function is used to search for span information, that is, the root event of a node. A trace can be found in multiple environments. For example, in the scenario where service A calls service B and then calls service C, the same trace may be found from services A, B, and C.
- Log in to the management console.
- Click
 on the left and choose Management & Deployment > Application Performance Management.
 - In the navigation pane, choose Application Monitoring > Tracing.
- Select a time range in the upper right corner of the page. Default: Last 20 minutes. Options: Last 20 minutes, Last hour, Last 3 hours, Last 6 hours, Last day, Today, Yesterday, or Custom.
- Specify the following search criteria or add custom criteria to query traces.
Table 1 Search criteria of traces Search Criterion
Description
Mandatory
Application
Application to which the trace belongs.
Yes
Region
Region where the trace is located.
Yes
Component
Component to which the trace belongs.
No
Environment
Environment to which the trace belongs.
No
Instance
Instance to which the trace belongs.
No
URL
Trace URL, which can be a REST URL or real URL. A REST URL contains a variable name, for example, /apm/get/{id}. A real URL indicates an actual URL.
No
Exact Search
Whether to perform exact match on URLs. If this option is selected, exact match is performed. If this option is not selected, fuzzy match is performed.
No
Call Method
HTTP method of the trace.
No
Status Code
HTTP status code returned by the trace.
No
Response Time
Response time range of the trace. You can specify the minimum and maximum response time to search for the trace or leave them empty.
No
Exception or Not
Whether to filter the traces that are regarded as exceptions.
No
Trace ID
If you specify this parameter, other search criteria become invalid and the search will be performed based on the trace ID you specify.
No
Custom Parameter
- Custom search is supported for otel.scope.name and thread.id only. For more, contact O&M personnel.
- Search for traces by call parameter. The format is key=value. Example: exceptionMsg=failed.
- Configure required parameters before you search for traces by custom parameter. For example, if you have configured Key for Header Value Interception, Key for Parameter Value Interception, and Key for Cookie Value Interception for URL monitoring, you can set key=value to search, for example, httpMethod=POST.
No
Global Trace ID
Global ID of a trace. If you specify this parameter, other search criteria become invalid and the search will be performed based on the trace ID you specify.
No
Application Code
If you have configured Service Code Length, Key for Service Code Interception, and Normal Service Code, corresponding application codes will be collected. You can search information based on application codes. Generally, the value of Application Code is the same as the value of Normal Service Code. For details about how to configure URL monitoring, see Configuring the URL Monitoring Item.
No
- Click Search Trace to filter the traces that meet search criteria.
- Only the traces of successful or failed requests can be displayed. The following uses Successful Request as an example.
- Click the green button next to Successful Request, only the traces of successful requests are displayed. The red button next to Failed Request becomes grayed.
- If you click the green button again, both the traces of successful and failed requests are displayed. The red button is no longer grayed.
- The green and red buttons cannot be grayed at the same time.
- Response Time: response time of a trace. Click Response Time. Traces are sorted by response time in descending order, and
 is displayed. Click Response Time again. Traces are sorted by response time in ascending order, and
  is displayed. Click Response Time for the third time. The trace list is restored to the initial state and
  is displayed.
 - Generated: start time of a trace. You can sort traces by generation time. The sorting method is similar to that of Response Time.
- You can click Clear to clear the search criteria and results.
You can also click a specific URL on the monitoring item view page, for example, the table view of the URL monitoring item. In this way, you can quickly search for required trace information based on preset search criteria.
- Only the traces of successful or failed requests can be displayed. The following uses Successful Request as an example.
Checking Trace Details
Viewing Basic Information About the Trace Filtered Based on the Search Criteria
In the displayed trace list, click  next to the target trace to view its basic information, as shown in the following figure.
Figure 1 Basic information about a trace
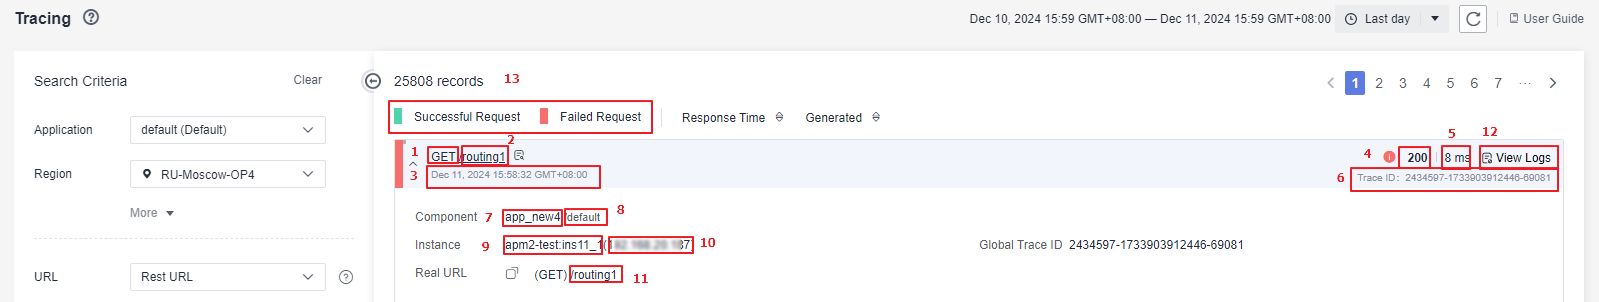
Parameter description:
- HTTP method of the trace.
- REST URL of the trace. A REST URL contains a variable name, for example, /apm/get/{id}. You can click the URL to go to the trace details page.
- Start time of the trace.
- HTTP status code returned by the trace.
- Response time of the trace.
- Trace ID.
- Component to which the trace belongs.
- Environment to which the trace belongs.
- Host of the instance to which the trace belongs.
- IP address of the instance to which the trace belongs.
- Actual URL of the trace.
- View logs.
- On the LTS console, configure collection. For details, see section "Ingesting ECS Text Logs to LTS" in the Log Tank Service (LTS) User Guide.
- Click View Logs to go to the LTS page based on the trace ID. For details about how to search for logs on the LTS console, see Searching for Logs.
- If the function of associating trace IDs with logs is not enabled, a warning dialog box is displayed. Click Associate Now to go to the log association settings page. For details about how to associate logs with trace IDs, see Component Settings.
Viewing the Complete Information About the Trace, Including Local Method Stacks and Remote Call Relationships
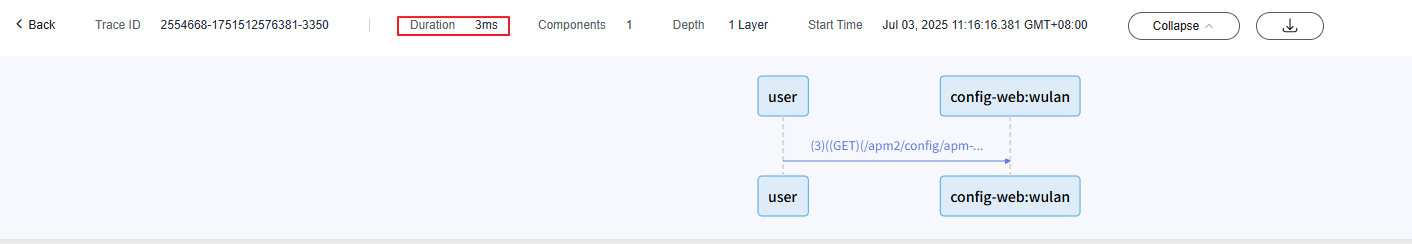
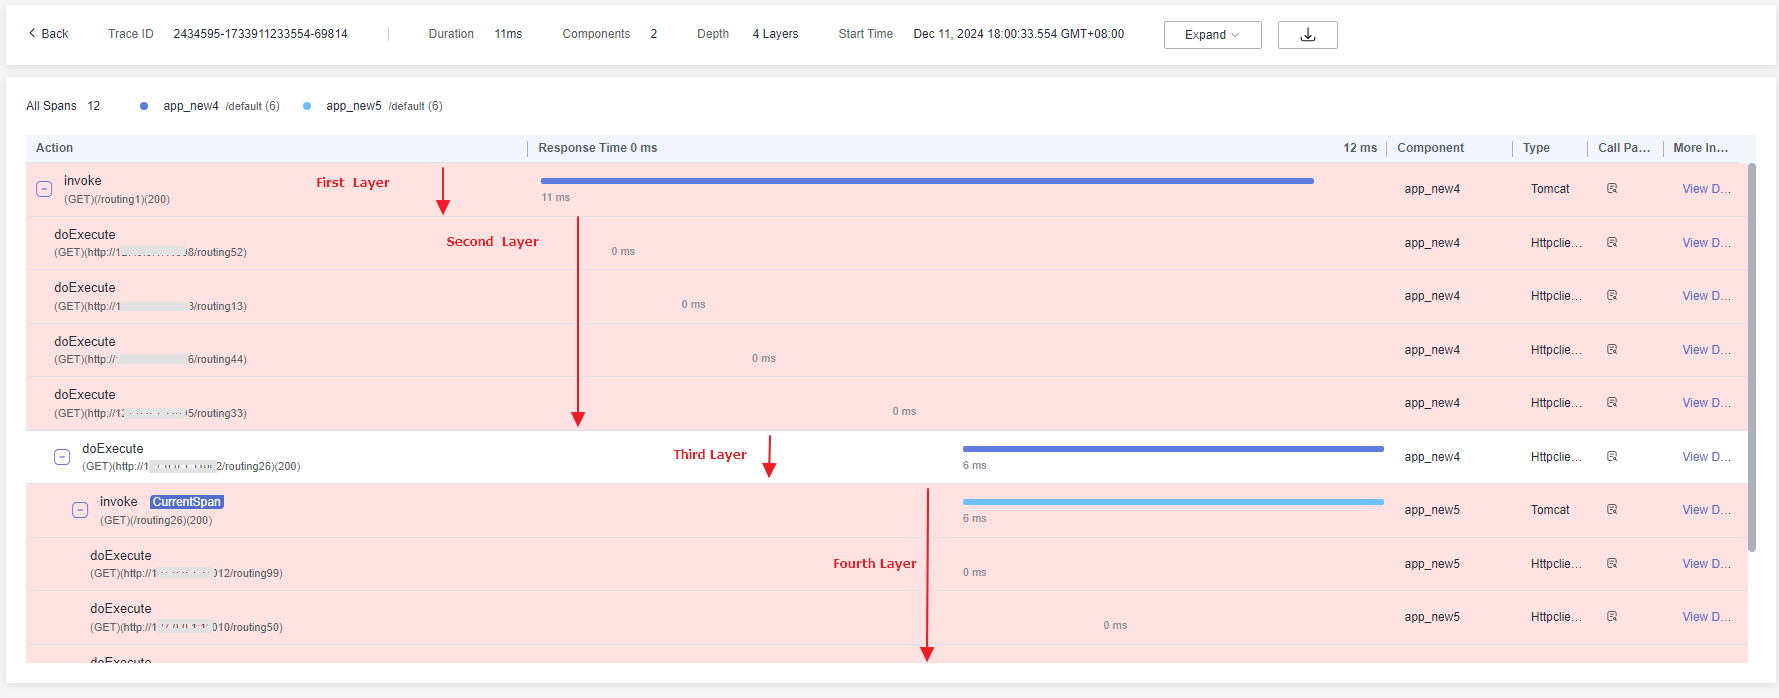
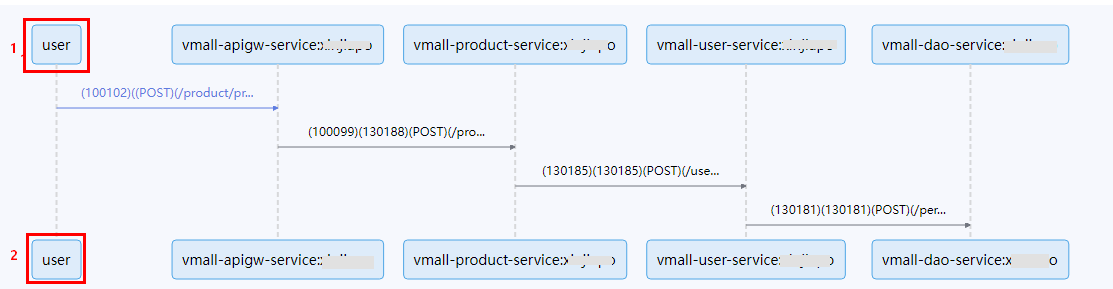
Click the name of a trace to view its details, as shown in the following figure.
- The upper part is the sequence diagram of the trace, which shows complete call relationships between components. This diagram contains the information about the client and server corresponding to each call. The lower the line is, the later a call occurs.
- The lower part lists the method stack details of the trace. Each line indicates a method call. You can view the detailed method call relationships of the trace. By default, only component methods supported by JavaAgents are displayed. To display application methods, configure the application methods to be intercepted during JavaMethod configuration.
Figure 2 Call relationship
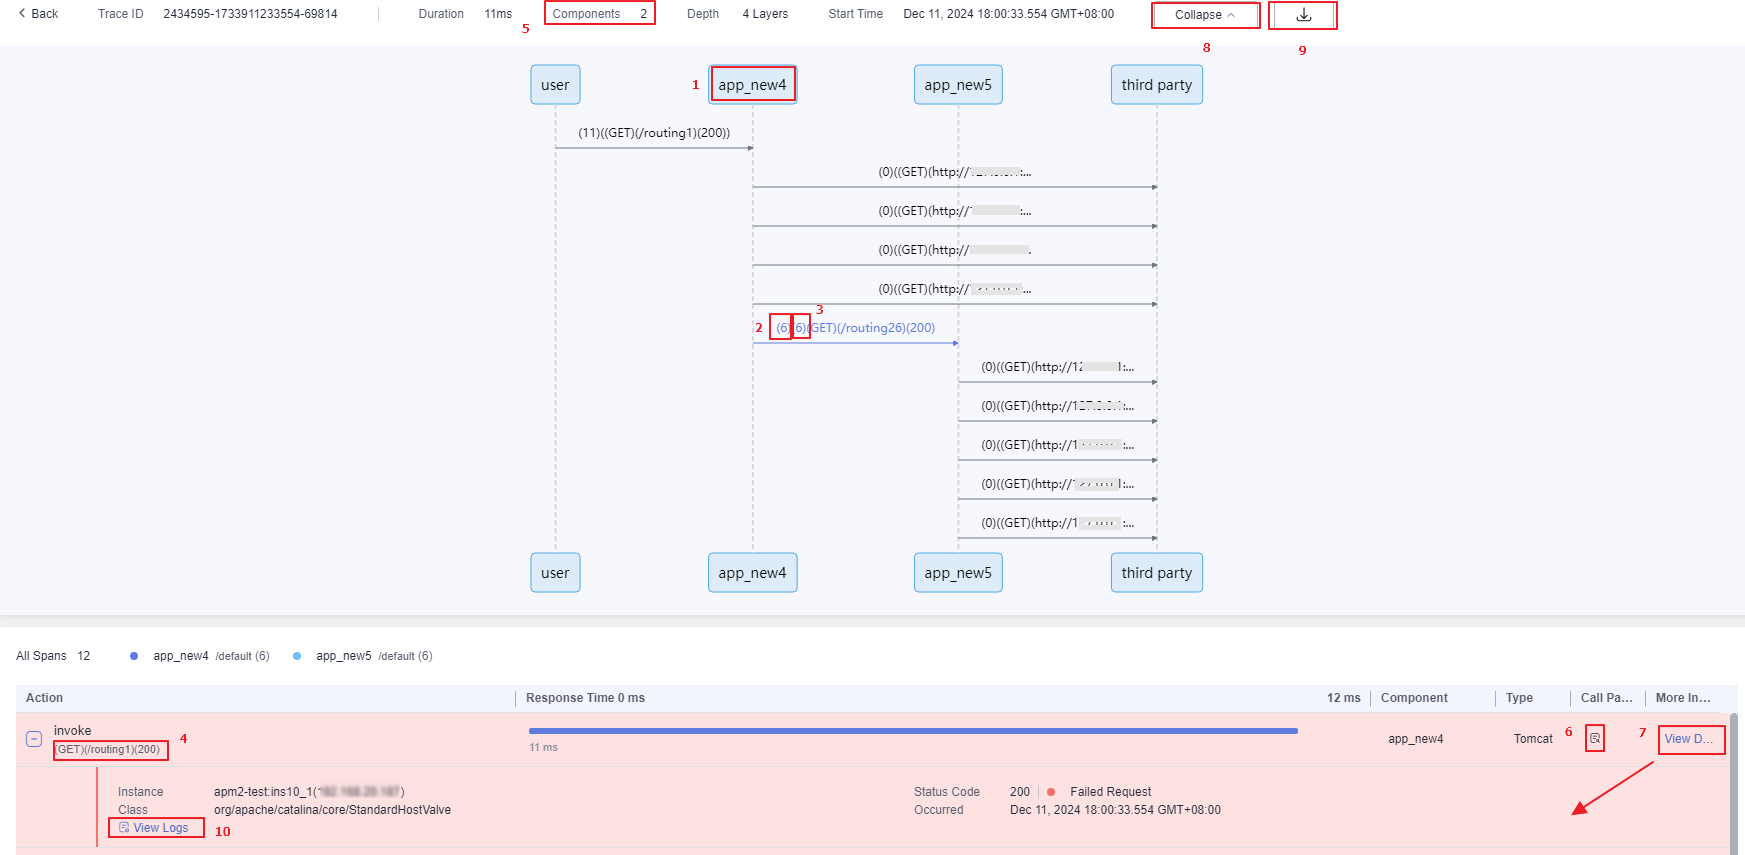
Parameter description:
- Component and environment to which the called API belongs
- Response time (unit: ms) of the client. You can hover the pointer over the line between components to view the client and server information.
- Real URL: REST URL of the trace. A REST URL contains a variable name, for example, /apm/get/{id}.
- Response time: response time of the trace.
- Response time (unit: ms) of the server.
- Key parameter of the method in the trace method stack. For example, for a Tomcat entry method, a real URL is displayed. For a MySQL call method, an executed SQL statement is displayed.
- Number of components that are involved.
- Call parameters. Click
 to view the call parameters.
 - Click View Details. The span details are displayed.
- Click Collapse if required.
Figure 3 Hiding the time sequence diagram
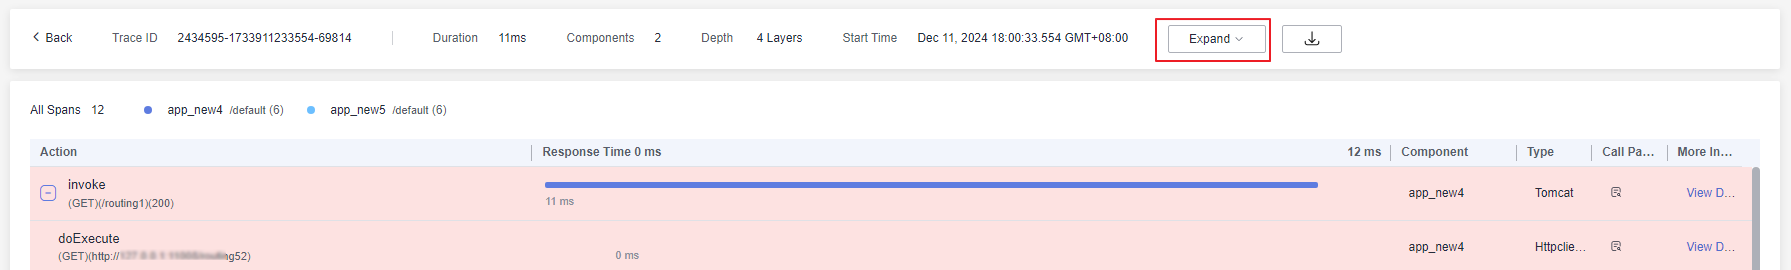
You can also click Expand.
- Click
 to download the sequence diagram.
 - Click View Logs to go to the LTS page based on the trace ID. For details, see Viewing Logs.
- Traces are displayed in a tree. Depth indicates the number of layers in the tree.
Figure 4 Depth
- The content displayed in positions 1 and 2 in the sequence diagram of a trace varies depending on the Agent type or connected website/app.
Agent Type or Connected Website/App
Display Content
Web
WEB
WeChat
WE_CHAT
Baidu
BAIDU
Alipay
ALIPAY
DingTalk
DING_TALK
Mobile app (Android)
ANDROID-APP
Mobile app (iOS)
IOS-APP
Mobile app (HarmonyOS)
HARMONY-APP
Others
user
- Duration, that is, the total time of a trace request.
Figure 5 Duration