При обслуживании масштабных кластеров Elasticsearch команды эксплуатации часто сталкиваются с критическим пробелом в видимости: хотя метрики на уровне кластера (например CPU и memory) показывают здоровое состояние, отдельные рабочие нагрузки или сервисы испытывают длительные задержки чтения/записи. Традиционный мониторинг на уровне кластера часто опирается на агрегированные средние значения и не позволяет определить конкретные индексы, вызывающие проблему. В результате анализ первопричин часто занимает много времени и требует значительных трудозатрат. CSS поддерживает index-level monitoring. Он автоматически собирает в реальном времени трафик чтения/записи, задержки и изменения хранилища для каждого индекса и визуализирует данные с помощью встроенного дашборда Kibana. Это помогает быстро выявлять аномальные индексы без написания сложных скриптов. Затем можно внести необходимые коррективы для оптимизации производительности и обеспечения стабильности сервиса.
Как работает функция
Index monitoring отслеживает статус и производительность каждого индекса в кластере Elasticsearch в реальном времени, помогая командам эксплуатации быстро обнаруживать и устранять проблемы с производительностью. Функция работает следующим образом:
- Сбор: Фоновая задача периодически (по умолчанию каждые 10 секунд, настраиваемо) собирает статистику по каждому целевому индексу, включая количество документов, размер хранилища и статус shard.
- Хранение: Собранные данные записываются в выделенный индекс мониторинга с именем monitoring-eye-css-[yyyy-mm-dd].
- Визуализация: Kibana читает данные из индекса мониторинга и визуализирует их с помощью предустановленных дашбордов или пользовательских визуализаций, позволяя выполнять анализ временных рядов, сравнение тенденций и обнаружение сбоев.
Ограничения
- Только Elasticsearch 7.6.2 и 7.10.2 поддерживают index monitoring.
- Не создавайте обычные индексы, имена которых начинаются с monitoring-eye-css-*. Это может помешать сбору данных index monitoring.
- Не удаляйте индекс monitoring-eye-css-[yyyy-mm-dd] или связанный с ним шаблон индекса. В противном случае данные index monitoring будут недоступны.
Вход в Kibana
Войдите в Kibana и перейдите на страницу выполнения команд. Кластеры Elasticsearch поддерживают несколько методов доступа. В этом разделе в качестве примера используется Kibana для описания процедур эксплуатации.
- Войдите в консоль управления CSS.
- В панели навигации слева выберите Clusters > Elasticsearch.
- В списке кластеров найдите целевой кластер и нажмите Kibana в столбце Operation, чтобы войти в консоль Kibana.
- В левой панели навигации выберите Dev Tools.
Левая часть консоли — это поле ввода команды, а треугольный значок в её правом верхнем углу является кнопкой выполнения. Правая часть отображает результат выполнения.
Включение мониторинга индексов
- Выполните следующую команду, чтобы включить мониторинг всех индексов в текущем кластере:PUT _cluster/settings{"persistent": {"css.monitoring.index.enabled": "true"}}
- Выполните следующую команду, чтобы включить мониторинг указанных индексов с высоким приоритетом:PUT _cluster/settings{"persistent": {"css.monitoring.index.enabled": "true","css.monitoring.index.interval": "30s","css.monitoring.index.indices": ["index_name"],"css.monitoring.history.duration": "3d"}}
Параметр | Тип | Значение по умолчанию | Описание |
|---|---|---|---|
css.monitoring.index.enabled | Boolean | false | Для включения или отключения мониторинга индексов. Значение может быть:
|
css.monitoring.index.indices | String | * (означает, что все индексы будут мониториться) | Имена индексов, которые вы хотите мониторить.
По умолчанию мониторятся все индексы. Если у вас большое количество индексов, рассмотрите возможность мониторинга только индексов с высоким приоритетом. |
css.monitoring.index.interval | Время | 10s | Интервал сбора данных мониторинга индексов. Формат значения: число + единица измерения
Минимальное значение: 1s Установите подходящий интервал сбора данных в зависимости от ваших потребностей в мониторинге и нагрузки кластера. Слишком частый сбор данных мониторинга может повлиять на производительность. |
css.monitoring.history.duration | Time | 7d | Срок хранения данных мониторинга индекса, то есть данных в индексе monitoring-eye-css-[yyyy-mm-dd]. По истечении срока данные будут удалены автоматически и без возможности восстановления. Формат значения: число + единица измерения
Минимальное значение: 1d Установите подходящий срок хранения данных, чтобы сбалансировать потребности мониторинга и затраты на хранение. Более длительный срок хранения увеличивает затраты на хранение. |
Проверка трафика чтения и записи индексов
Когда мониторинг индексов включён для кластера, вы можете использовать API для запроса трафика чтения и записи индексов в реальном времени.
Системные индексы (те, которые начинаются с .) содержат информацию внутреннего управления и обслуживания. Для обеспечения безопасности системы их трафик чтения и записи не может быть запрошен.
- Выполните следующую команду, чтобы запросить информацию о трафике чтения и записи всех индексов в кластере в реальном времени:GET /_cat/monitoring
- Выполните следующую команду, чтобы запросить трафик чтения и записи указанных индексов в кластере в реальном времени:GET /_cat/monitoring/{index_name}
- Выполните следующую команду, чтобы запросить трафик чтения/записи индексов за указанный период:GET _cat/monitoring?begin=1650099461000GET _cat/monitoring?begin=2022-04-16T08:57:41GET _cat/monitoring?begin=2022-04-16T08:57:41&end=2022-04-17T08:57:41
Параметр | Тип | Значение по умолчанию | Описание |
|---|---|---|---|
index_name | String | N/A | Указывает один или несколько индексов.
|
начало | Строка | Последние 5 минут | Время начала периода мониторинга. Используйте время UTC. Поддерживаемые форматы:
|
конец | Строка | Текущее время | Время окончания периода мониторинга. Используйте время UTC. Поддерживаемые форматы:
|
Пример ответа:
index begin end status pri rep init unassign docs.count docs.deleted store.size pri.store.size delete.rate indexing.rate search.ratetest 2022-03-25T09:46:53.765Z 2022-03-25T09:51:43.767Z yellow 1 1 0 1 9 0 5.9kb 5.9kb 0/s 0/s 0/s
Параметр | Описание |
|---|---|
index | Имя индекса. |
begin | Время начала запрашиваемых данных мониторинга. |
end | Время окончания запрашиваемых данных мониторинга. |
status | Состояние индекса за запрашиваемый период. |
pri | Количество шардов индекса за запрашиваемый период. |
rep | Количество реплик индекса за запрашиваемый период. |
init | Количество инициализированных индексов за запрашиваемый период. |
unassign | Количество нераспределённых индексов за запрашиваемый период. |
docs.count | Количество документов за запрашиваемый период. |
docs.deleted | Количество удалённых документов за запрашиваемый период. |
store.size | Размер хранилища индекса за запрашиваемый период. |
pri.store.size | Размер основного шарда индекса в течение запрашиваемого периода. |
delete.rate | Количество удалённых индексов в секунду в течение запрашиваемого периода. |
indexing.rate | Количество записанных индексов в секунду в течение запрашиваемого периода. |
search.rate | Количество запрашиваемых индексов в секунду в течение запрашиваемого периода. |
Визуализация и анализ данных мониторинга индексов в Kibana
Kibana обеспечивает эффективный анализ данных мониторинга индексов, включая анализ временных рядов, сравнение тенденций и обнаружение неисправностей.
CSS предоставляет предустановленную панель Kibana dashboard, позволяющую быстро просматривать информацию мониторинга индексов. Вы также можете создавать пользовательские визуализации в Kibana для более гибкого мониторинга.
- Проверьте результаты мониторинга индексов в предустановленной панели dashboard.
- В консоли Kibana нажмите кнопку меню в левом верхнем углу и нажмите Dashboard.
- Найдите и нажмите [Monitoring] Index monitoring Dashboard, чтобы просмотреть результаты мониторинга индексов.
Предустановленная панель dashboard отображает количество операций чтения и записи в секунду в кластере, а также топ‑10 индексов по запросам чтения и записи.
Рисунок 1 Предустановленная панель dashboard
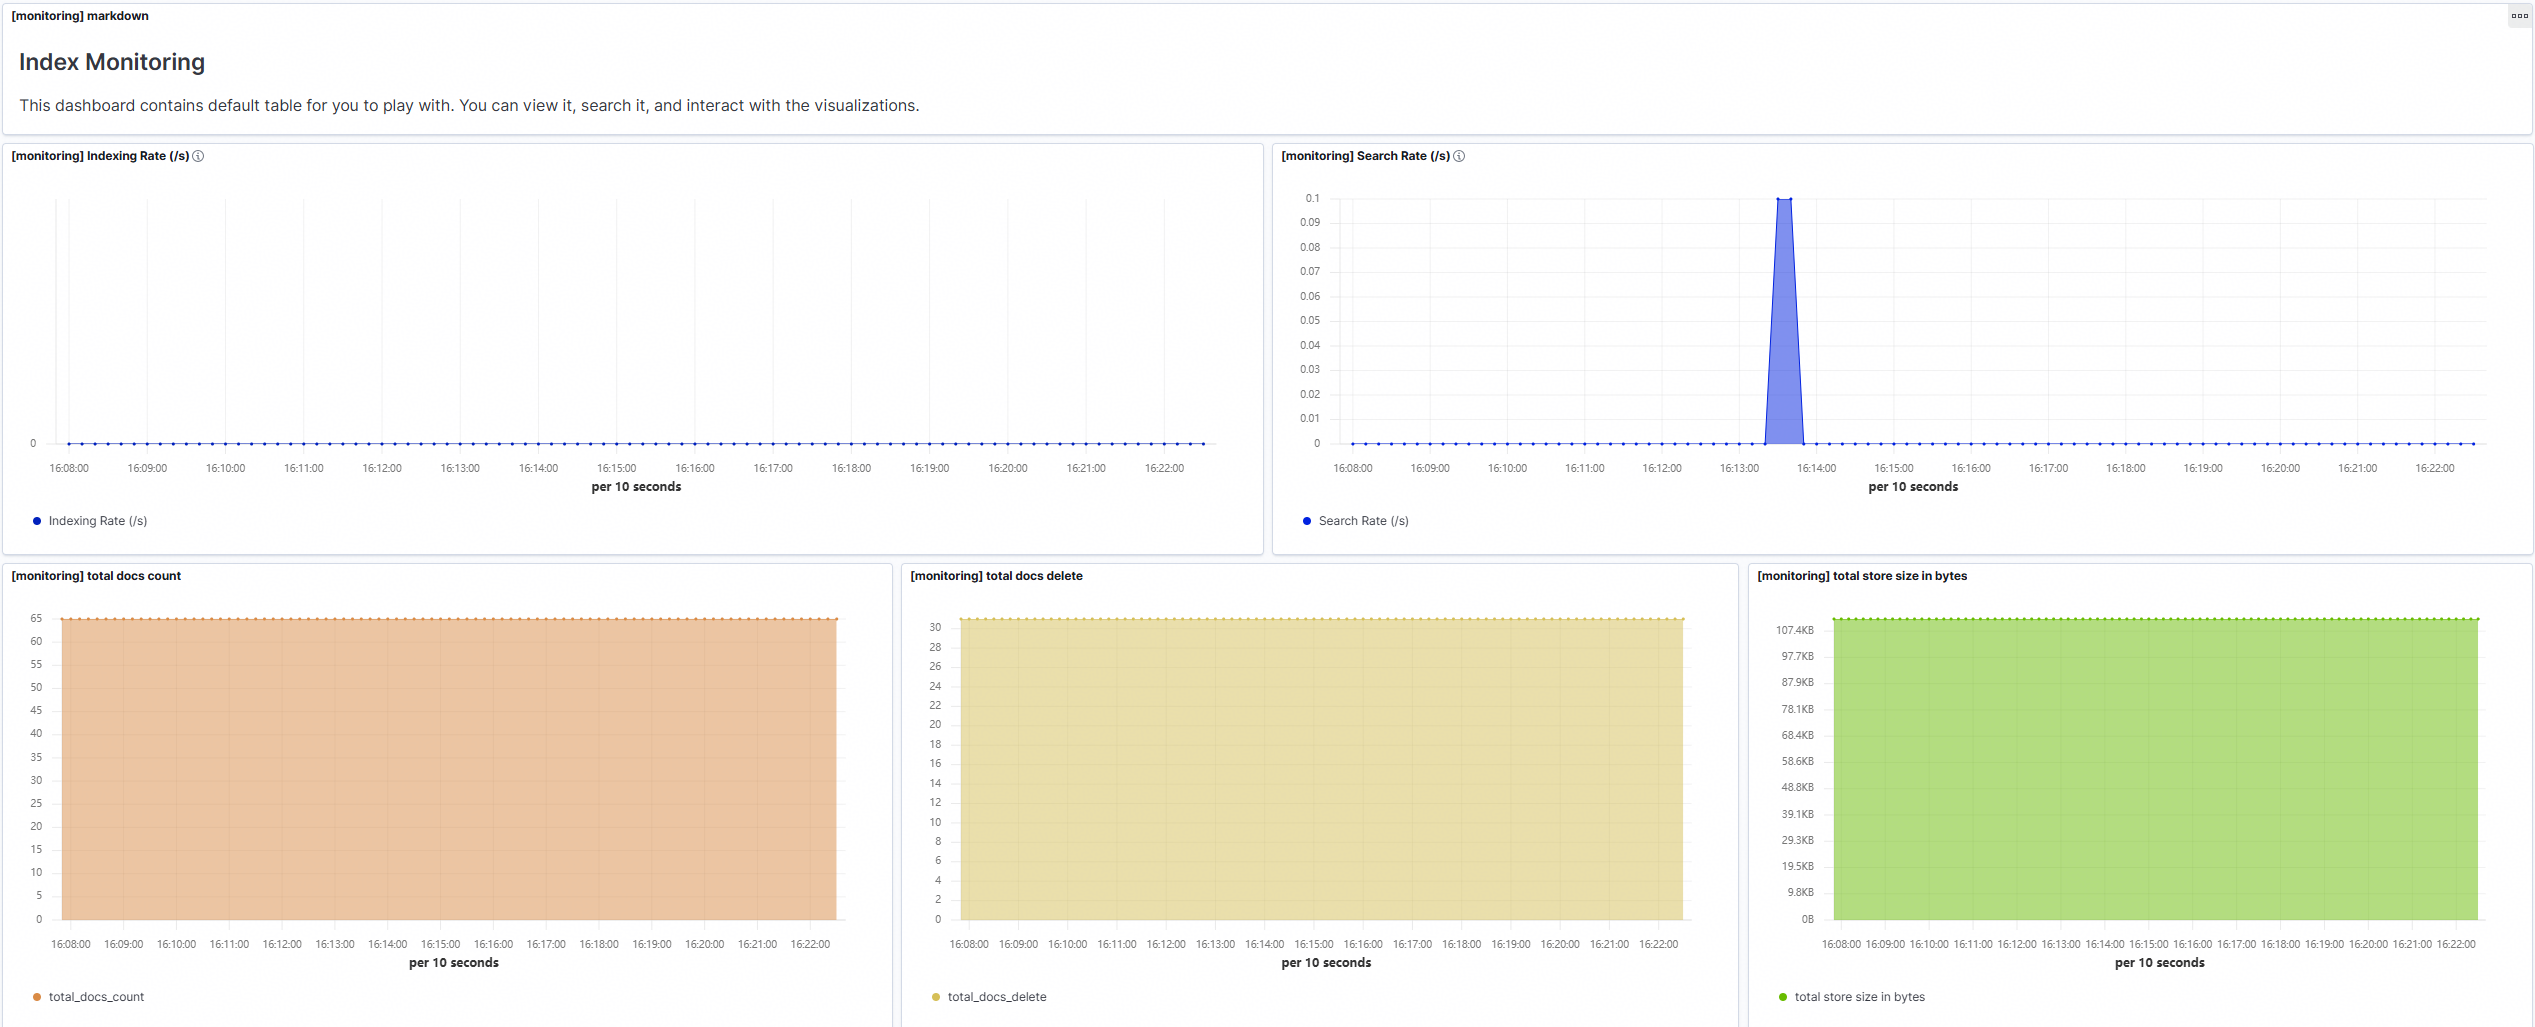
Table 4 Диаграммы на pre-built dashboard Chart Name
Description
[monitoring] markdown
Диаграмма markdown, кратко описывающая содержимое dashboard.
[monitoring] Indexing Rate (/s)
Количество документов, записываемых в кластер в секунду.
[monitoring] Search Rate (/s)
Среднее количество запросов в секунду в кластере.
[monitoring] indexing rate of index for top10
Топ‑10 индексов с наибольшим количеством записываемых в секунду документов.
[monitoring] search rate of index for top10
Топ‑10 индексов с наибольшим количеством запросов в секунду.
[monitoring] total docs count
Общее количество документов в кластере.
[monitoring] total docs delete
Общее количество удалённых документов в кластере.
[monitoring] total store size in bytes
Общий объём хранения, занимаемый документами в кластере.
[monitoring] indices store_size for top10
Топ‑10 индексов, занимающих наибольший объём хранения.
[monitoring] indices docs_count for top10
Топ‑10 индексов, содержащих наибольшее количество документов.
[monitoring] indexing time in millis of index for top10(ms)
Топ‑10 индексов с наибольшей задержкой записи документов за единицу времени (мс).
[monitoring] search query time in millis of index for top10(ms)
Топ‑10 индексов с наибольшим временем выполнения запросов к индексу за единицу времени (мс).
[monitoring] segment count of index for top10
Топ‑10 индексов с наибольшим количеством сегментов индекса.
[monitoring] segment memory in bytes of index for top10
Топ‑10 индексов с наибольшим использованием кучи памяти сегментов индекса.
- Проверьте результаты мониторинга индексов в пользовательских визуализациях.
Следующая процедура описывает, как создать пользовательскую визуализацию для мониторинга изменений количества документов в индексах.
- нажмите Visualize в меню в верхнем левом углу консоли Kibana.
- нажмите Create visualization, затем выберите TSVB.
- Установите параметры диаграммы.
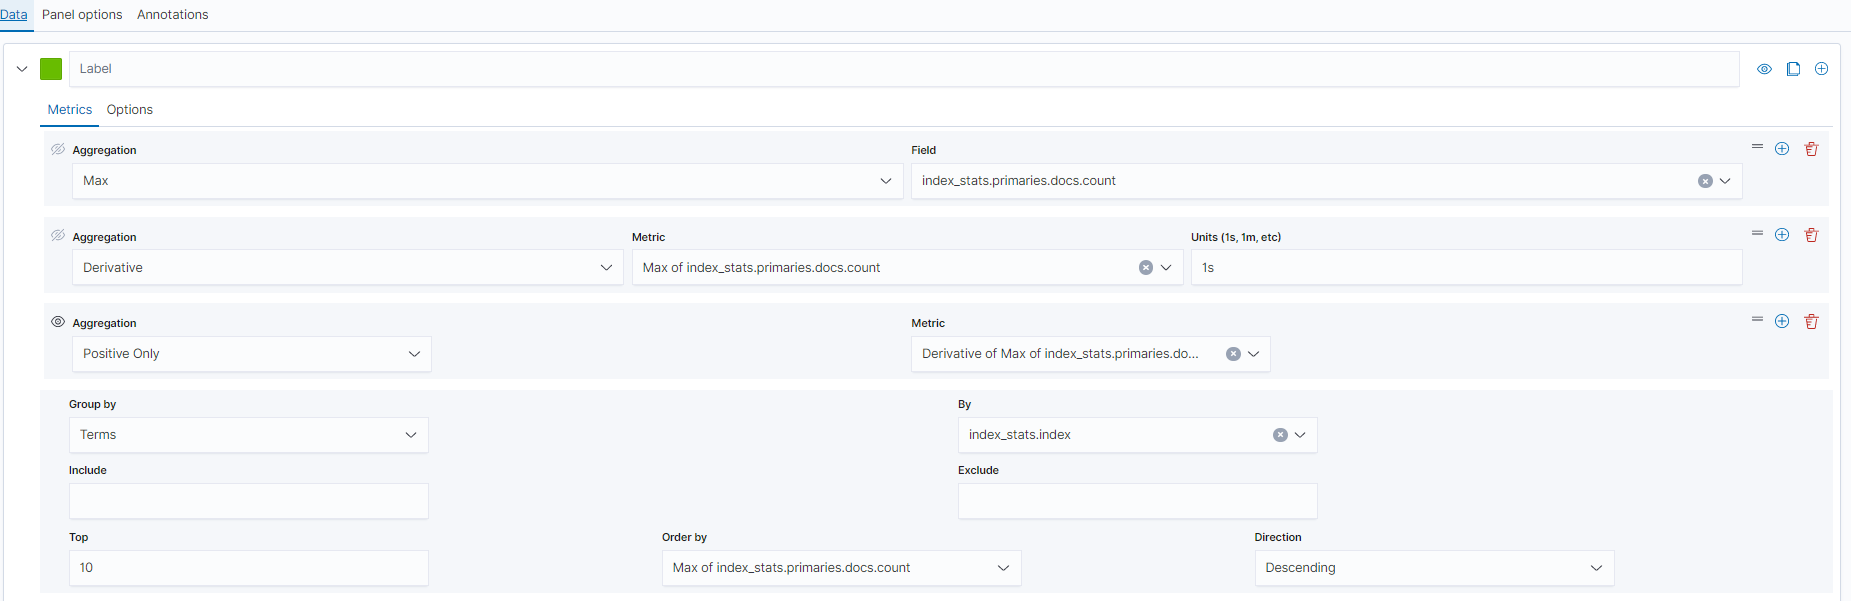
На вкладке Data, показанной в Figure 2, установите параметры по необходимости.
- Выберите Max для Aggregation и выберите index_stats.primaries.docs.count в поле Field, указывая количество документов в первичном шарде.
- Выберите Derivative из Aggregation, чтобы отразить различия между корзинами агрегации. Установите Units в 1s для визуализации сетевых скоростей как «per second».
- Установите Aggregation в Positive Only, чтобы предотвратить появление отрицательных чисел после сброса.
- Чтобы отобразить статистику по индексу, установите Group by в Terms и By в index_stats.index. Статистика будет сгруппирована по имени индекса.
Figure 2 TSVB page
Чтобы просматривать данные в разных временных сегментах, задайте интервал агрегации, иначе отображаемые данные будут неполными. На странице, показанной в Figure 3, выберите вкладку Panel options и установите Interval в 1m или 30m, чтобы скорректировать гранулярность timestamp.
Figure 3 Настройка интервала

FAQ: Что делать, если диаграммы мониторинга индексов не отображаются?
Симптом: Предустановленные дашборды и визуализации кластера не отображаются.
Решение:
- В списке кластеров проверьте, включён ли режим безопасности для кластера.
- Если Security Mode имеет значение Enabled, переключитесь на Global space.
На странице Kibana нажмите имя пользователя в правом верхнем углу и выберите Switch tenants. На странице Select your tenant переключите пространство и нажмите Confirm. Затем проверьте, отображаются ли теперь диаграммы корректно. Если они всё ещё не отображаются, перейдите к следующему шагу.
- Если Security Mode имеет значение Disabled, перейдите к следующему шагу.
- Если Security Mode имеет значение Enabled, переключитесь на Global space.
- Импортируйте диаграммы повторно.
- Создайте файл monitoring-kibana.ndjson, ссылаясь на kibana-monitor Configuration File.
- В консоли Kibana выберите Management > Stack Management > Saved objects.
Рисунок 4 Выбор сохранённых объектов
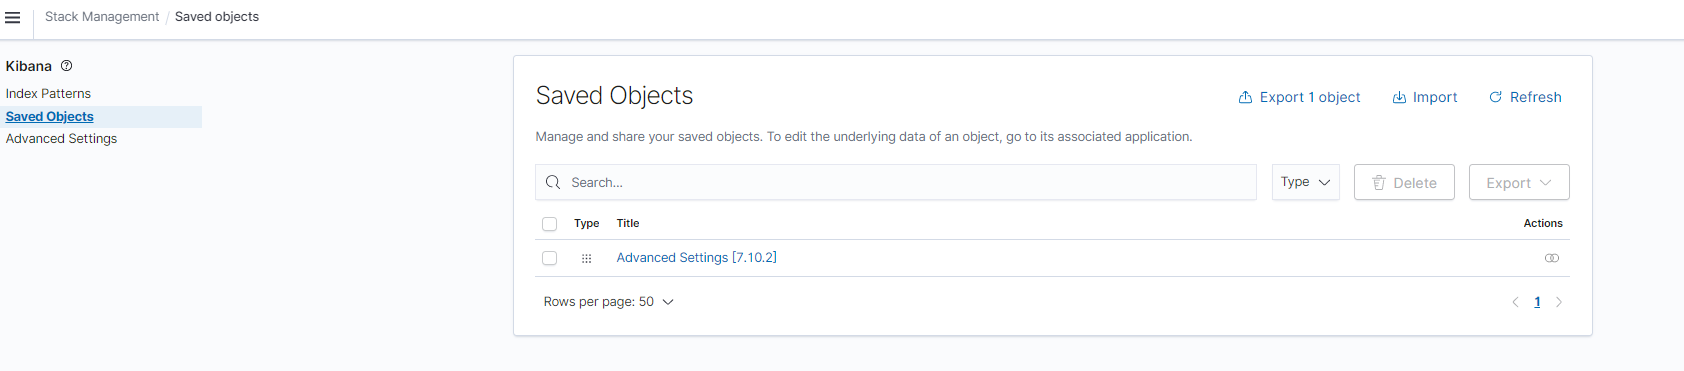
- Нажмите Import и загрузите созданный файл monitoring-kibana.ndjson.
Рисунок 5 Загрузка файла
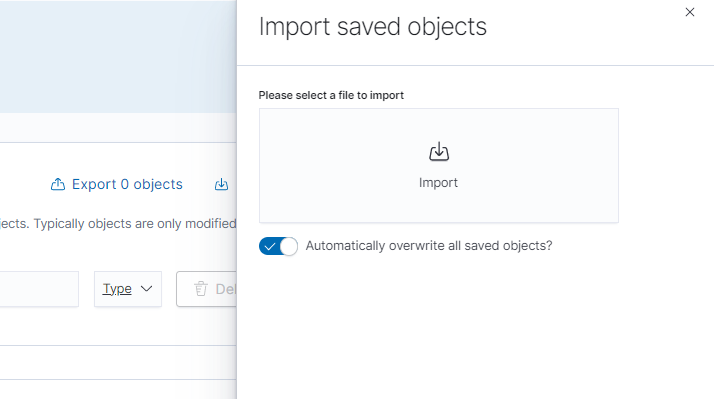
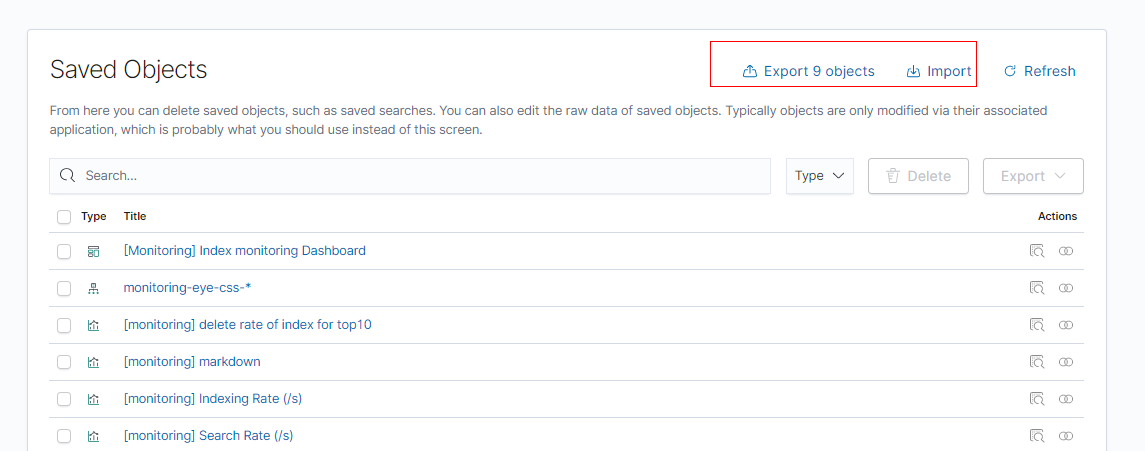
- После загрузки файла нажмите done. Диаграммы мониторинга индекса импортированы успешно.
Рисунок 6 Диаграммы мониторинга индекса импортированы успешно
Если проблема сохраняется, обратитесь в техническую поддержку.
kibana-monitor Файл конфигурации
Содержимое kibana-monitor файла конфигурации выглядит следующим образом. Рекомендуется сохранить файл как monitoring-kibana.ndjson.
{"attributes":{"description":"","kibanaSavedObjectMeta":{"searchSourceJSON":"{}"},"title":"[monitoring] segment memory in bytes of index for top10","uiStateJSON":"{}","version":1,"visState":"{\"title\":\"[monitoring] segment memory in bytes of index for top10\",\"type\":\"metrics\",\"aggs\":[],\"params\":{\"id\":\"61ca57f0-469d-11e7-af02-69e470af7417\",\"type\":\"timeseries\",\"series\":[{\"id\":\"61ca57f1-469d-11e7-af02-69e470af7417\",\"color\":\"#68BC00\",\"split_mode\":\"terms\",\"split_color_mode\":\"kibana\",\"metrics\":[{\"id\":\"61ca57f2-469d-11e7-af02-69e470af7417\",\"type\":\"max\",\"field\":\"index_stats.total.segments.memory_in_bytes\"}],\"separate_axis\":0,\"axis_position\":\"right\",\"formatter\":\"bytes\",\"chart_type\":\"line\",\"line_width\":1,\"point_size\":1,\"fill\":0.5,\"stacked\":\"none\",\"label\":\"segments memory in bytes \",\"type\":\"timeseries\",\"terms_field\":\"index_stats.index\",\"terms_order_by\":\"61ca57f2-469d-11e7-af02-69e470af7417\"}],\"time_field\":\"timestamp\",\"index_pattern\":\"monitoring-eye-css-*\",\"interval\":\"\",\"axis_position\":\"left\",\"axis_formatter\":\"number\",\"axis_scale\":\"normal\",\"show_legend\":1,\"show_grid\":1,\"tooltip_mode\":\"show_all\",\"default_index_pattern\":\"monitoring-eye-css-*\",\"default_timefield\":\"timestamp\",\"isModelInvalid\":false}}"},"id":"3ae5d820-6628-11ed-8cd7-973626cf6f70","references":[],"type":"visualization","updated_at":"2022-12-01T12:41:01.165Z","version":"WzIwNiwyXQ=="}{"attributes":{"description":"","kibanaSavedObjectMeta":{"searchSourceJSON":"{}"},"title":"[monitoring] segment count of index for top10","uiStateJSON":"{}","version":1,"visState":"{\"aggs\":[],\"params\":{\"axis_formatter\":\"number\",\"axis_position\":\"left\",\"axis_scale\":\"normal\",\"default_index_pattern\":\"monitoring-eye-css-*\",\"default_timefield\":\"timestamp\",\"filter\":{\"language\":\"kuery\",\"query\":\"\"},\"id\":\"61ca57f0-469d-11e7-af02-69e470af7417\",\"index_pattern\":\"monitoring-eye-css-*\",\"interval\":\"\",\"isModelInvalid\":false,\"series\":[{\"axis_position\":\"right\",\"chart_type\":\"line\",\"color\":\"rgba(231,102,76,1)\",\"fill\":0.5,\"formatter\":\"number\",\"id\":\"61ca57f1-469d-11e7-af02-69e470af7417\",\"label\":\"segment count of index for top10\",\"line_width\":1,\"metrics\":[{\"field\":\"index_stats.total.segments.count\",\"id\":\"61ca57f2-469d-11e7-af02-69e470af7417\",\"type\":\"max\"}],\"point_size\":1,\"separate_axis\":0,\"split_color_mode\":\"kibana\",\"split_mode\":\"terms\",\"stacked\":\"none\",\"terms_field\":\"index_stats.index\",\"terms_order_by\":\"61ca57f2-469d-11e7-af02-69e470af7417\",\"type\":\"timeseries\"}],\"show_grid\":1,\"show_legend\":1,\"time_field\":\"timestamp\",\"tooltip_mode\":\"show_all\",\"type\":\"timeseries\"},\"title\":\"[monitoring] segment count of index for top10\",\"type\":\"metrics\"}"},"id":"45d571c0-6626-11ed-8cd7-973626cf6f70","references":[],"type":"visualization","updated_at":"2022-12-01T12:41:01.165Z","version":"WzIwNywyXQ=="}{"attributes":{"description":"","kibanaSavedObjectMeta":{"searchSourceJSON":"{}"},"title":"[monitoring] markdown","uiStateJSON":"{}","version":1,"visState":"{\"title\":\"[monitoring] markdown\",\"type\":\"markdown\",\"params\":{\"fontSize\":12,\"openLinksInNewTab\":false,\"markdown\":\"### Index Monitoring \\nThis dashboard contains default table for you to play with. You can view it, search it, and interact with the visualizations.\"},\"aggs\":[]}"},"id":"b2811c70-a5f1-11ec-9a68-ada9d754c566","references":[],"type":"visualization","updated_at":"2022-12-01T12:41:01.165Z","version":"WzIwOCwyXQ=="}{"attributes":{"description":"number of document being indexing for primary and replica shards","kibanaSavedObjectMeta":{"searchSourceJSON":"{}"},"title":"[monitoring] Indexing Rate (/s)","uiStateJSON":"{}","version":1,"visState":"{\"title\":\"[monitoring] Indexing Rate (/s)\",\"type\":\"metrics\",\"params\":{\"id\":\"61ca57f0-469d-11e7-af02-69e470af7417\",\"type\":\"timeseries\",\"series\":[{\"id\":\"61ca57f1-469d-11e7-af02-69e470af7417\",\"color\":\"rgba(0,32,188,1)\",\"split_mode\":\"everything\",\"metrics\":[{\"id\":\"61ca57f2-469d-11e7-af02-69e470af7417\",\"type\":\"max\",\"field\":\"indices_stats._all.total.indexing.index_total\"},{\"unit\":\"1s\",\"id\":\"fed72db0-a5f8-11ec-aa10-992297d21a2e\",\"type\":\"derivative\",\"field\":\"61ca57f2-469d-11e7-af02-69e470af7417\"},{\"unit\":\"\",\"id\":\"14b66420-a5f9-11ec-aa10-992297d21a2e\",\"type\":\"positive_only\",\"field\":\"fed72db0-a5f8-11ec-aa10-992297d21a2e\"}],\"separate_axis\":0,\"axis_position\":\"right\",\"formatter\":\"number\",\"chart_type\":\"line\",\"line_width\":1,\"point_size\":1,\"fill\":0.5,\"stacked\":\"none\",\"label\":\"Indexing Rate (/s)\",\"type\":\"timeseries\",\"split_color_mode\":\"rainbow\",\"hidden\":false}],\"time_field\":\"timestamp\",\"index_pattern\":\"monitoring-eye-css-*\",\"interval\":\"\",\"axis_position\":\"left\",\"axis_formatter\":\"number\",\"axis_scale\":\"normal\",\"show_legend\":1,\"show_grid\":1,\"default_index_pattern\":\"monitoring-eye-css-*\",\"default_timefield\":\"timestamp\",\"isModelInvalid\":false,\"legend_position\":\"bottom\"},\"aggs\":[]}"},"id":"de4f8ab0-a5f8-11ec-9a68-ada9d754c566","references":[],"type":"visualization","updated_at":"2022-12-01T12:41:01.165Z","version":"WzIwOSwyXQ=="}{"attributes":{"description":"number of search request being executed in primary and replica shards","kibanaSavedObjectMeta":{"searchSourceJSON":"{}"},"title":"[monitoring] Search Rate (/s)","uiStateJSON":"{}","version":1,"visState":"{\"title\":\"[monitoring] Search Rate (/s)\",\"type\":\"metrics\",\"params\":{\"id\":\"61ca57f0-469d-11e7-af02-69e470af7417\",\"type\":\"timeseries\",\"series\":[{\"id\":\"61ca57f1-469d-11e7-af02-69e470af7417\",\"color\":\"rgba(0,33,224,1)\",\"split_mode\":\"everything\",\"metrics\":[{\"id\":\"61ca57f2-469d-11e7-af02-69e470af7417\",\"type\":\"max\",\"field\":\"indices_stats._all.total.search.query_total\"},{\"unit\":\"1s\",\"id\":\"b1093ac0-a5f7-11ec-aa10-992297d21a2e\",\"type\":\"derivative\",\"field\":\"61ca57f2-469d-11e7-af02-69e470af7417\"},{\"unit\":\"\",\"id\":\"c17db930-a5f7-11ec-aa10-992297d21a2e\",\"type\":\"positive_only\",\"field\":\"b1093ac0-a5f7-11ec-aa10-992297d21a2e\"}],\"separate_axis\":0,\"axis_position\":\"right\",\"formatter\":\"number\",\"chart_type\":\"line\",\"line_width\":1,\"point_size\":1,\"fill\":0.5,\"stacked\":\"none\",\"split_color_mode\":\"rainbow\",\"label\":\"Search Rate (/s)\",\"type\":\"timeseries\",\"filter\":{\"query\":\"\",\"language\":\"kuery\"}}],\"time_field\":\"timestamp\",\"index_pattern\":\"monitoring-eye-css-*\",\"interval\":\"\",\"axis_position\":\"left\",\"axis_formatter\":\"number\",\"axis_scale\":\"normal\",\"show_legend\":1,\"show_grid\":1,\"default_index_pattern\":\"monitoring-eye-css-*\",\"default_timefield\":\"timestamp\",\"isModelInvalid\":false,\"legend_position\":\"bottom\"},\"aggs\":[]}"},"id":"811df7a0-a5f8-11ec-9a68-ada9d754c566","references":[],"type":"visualization","updated_at":"2022-12-01T12:41:01.165Z","version":"WzIxMCwyXQ=="}{"attributes":{"description":"","kibanaSavedObjectMeta":{"searchSourceJSON":"{}"},"title":"[monitoring] total docs count","uiStateJSON":"{}","version":1,"visState":"{\"title\":\"[monitoring] total docs count\",\"type\":\"metrics\",\"aggs\":[],\"params\":{\"id\":\"61ca57f0-469d-11e7-af02-69e470af7417\",\"type\":\"timeseries\",\"series\":[{\"id\":\"61ca57f1-469d-11e7-af02-69e470af7417\",\"color\":\"rgba(218,139,69,1)\",\"split_mode\":\"everything\",\"split_color_mode\":\"kibana\",\"metrics\":[{\"unit\":\"\",\"id\":\"61ca57f2-469d-11e7-af02-69e470af7417\",\"type\":\"max\",\"field\":\"indices_stats._all.total.docs.count\"}],\"separate_axis\":0,\"axis_position\":\"right\",\"formatter\":\"number\",\"chart_type\":\"line\",\"line_width\":1,\"point_size\":1,\"fill\":0.5,\"stacked\":\"none\",\"label\":\"total_docs_count\",\"type\":\"timeseries\"}],\"time_field\":\"timestamp\",\"index_pattern\":\"monitoring-eye-css-*\",\"interval\":\"\",\"axis_position\":\"left\",\"axis_formatter\":\"number\",\"axis_scale\":\"normal\",\"show_legend\":1,\"show_grid\":1,\"tooltip_mode\":\"show_all\",\"default_index_pattern\":\"monitoring-eye-css-*\",\"default_timefield\":\"timestamp\",\"isModelInvalid\":false,\"legend_position\":\"bottom\"}}"},"id":"eea89780-664b-11ed-8cd7-973626cf6f70","references":[],"type":"visualization","updated_at":"2022-12-01T12:41:01.165Z","version":"WzIxMSwyXQ=="}{"attributes":{"description":"","kibanaSavedObjectMeta":{"searchSourceJSON":"{}"},"title":"[monitoring] total docs delete","uiStateJSON":"{}","version":1,"visState":"{\"title\":\"[monitoring] total docs delete\",\"type\":\"metrics\",\"aggs\":[],\"params\":{\"id\":\"61ca57f0-469d-11e7-af02-69e470af7417\",\"type\":\"timeseries\",\"series\":[{\"id\":\"61ca57f1-469d-11e7-af02-69e470af7417\",\"color\":\"rgba(214,191,87,1)\",\"split_mode\":\"everything\",\"split_color_mode\":\"kibana\",\"metrics\":[{\"id\":\"61ca57f2-469d-11e7-af02-69e470af7417\",\"type\":\"max\",\"field\":\"indices_stats._all.total.docs.deleted\"}],\"separate_axis\":0,\"axis_position\":\"right\",\"formatter\":\"number\",\"chart_type\":\"line\",\"line_width\":1,\"point_size\":1,\"fill\":0.5,\"stacked\":\"none\",\"label\":\"total_docs_delete\",\"type\":\"timeseries\",\"hidden\":false}],\"time_field\":\"timestamp\",\"index_pattern\":\"monitoring-eye-css-*\",\"interval\":\"\",\"axis_position\":\"left\",\"axis_formatter\":\"number\",\"axis_scale\":\"normal\",\"show_legend\":1,\"show_grid\":1,\"tooltip_mode\":\"show_all\",\"default_index_pattern\":\"monitoring-eye-css-*\",\"default_timefield\":\"timestamp\",\"isModelInvalid\":false,\"drop_last_bucket\":1,\"legend_position\":\"bottom\"}}"},"id":"cfbb4e20-664c-11ed-8cd7-973626cf6f70","references":[],"type":"visualization","updated_at":"2022-12-01T12:41:01.165Z","version":"WzIxMiwyXQ=="}{"attributes":{"description":"","kibanaSavedObjectMeta":{"searchSourceJSON":"{}"},"title":"[monitoring] total store size in bytes","uiStateJSON":"{}","version":1,"visState":"{\"title\":\"[monitoring] total store size in bytes\",\"type\":\"metrics\",\"aggs\":[],\"params\":{\"id\":\"61ca57f0-469d-11e7-af02-69e470af7417\",\"type\":\"timeseries\",\"series\":[{\"id\":\"61ca57f1-469d-11e7-af02-69e470af7417\",\"color\":\"#68BC00\",\"split_mode\":\"everything\",\"split_color_mode\":\"kibana\",\"metrics\":[{\"id\":\"61ca57f2-469d-11e7-af02-69e470af7417\",\"type\":\"max\",\"field\":\"indices_stats._all.total.store.size_in_bytes\"}],\"separate_axis\":0,\"axis_position\":\"right\",\"formatter\":\"bytes\",\"chart_type\":\"line\",\"line_width\":1,\"point_size\":1,\"fill\":0.5,\"stacked\":\"none\",\"label\":\"total store size in bytes\",\"type\":\"timeseries\"}],\"time_field\":\"timestamp\",\"index_pattern\":\"monitoring-eye-css-*\",\"interval\":\"\",\"axis_position\":\"left\",\"axis_formatter\":\"number\",\"axis_scale\":\"normal\",\"show_legend\":1,\"show_grid\":1,\"tooltip_mode\":\"show_all\",\"default_index_pattern\":\"monitoring-eye-css-*\",\"default_timefield\":\"timestamp\",\"isModelInvalid\":false,\"legend_position\":\"bottom\",\"background_color_rules\":[{\"id\":\"7712e550-664f-11ed-8b5d-8db37e5b4cc4\"}],\"bar_color_rules\":[{\"id\":\"77680a30-664f-11ed-8b5d-8db37e5b4cc4\"}]}}"},"id":"c7f72ae0-664e-11ed-8cd7-973626cf6f70","references":[],"type":"visualization","updated_at":"2022-12-01T12:41:01.165Z","version":"WzIxMywyXQ=="}{"attributes":{"description":"","kibanaSavedObjectMeta":{"searchSourceJSON":"{}"},"title":"[monitoring] indexing rate of index for top10(/s)","uiStateJSON":"{}","version":1,"visState":"{\"title\":\"[monitoring] indexing rate of index for top10(/s)\",\"type\":\"metrics\",\"aggs\":[],\"params\":{\"id\":\"61ca57f0-469d-11e7-af02-69e470af7417\",\"type\":\"timeseries\",\"series\":[{\"id\":\"61ca57f1-469d-11e7-af02-69e470af7417\",\"color\":\"#68BC00\",\"split_mode\":\"terms\",\"metrics\":[{\"id\":\"61ca57f2-469d-11e7-af02-69e470af7417\",\"type\":\"max\",\"field\":\"index_stats.total.indexing.index_total\"},{\"unit\":\"1s\",\"id\":\"541ed8f0-a5ee-11ec-aa10-992297d21a2e\",\"type\":\"derivative\",\"field\":\"61ca57f2-469d-11e7-af02-69e470af7417\"},{\"unit\":\"\",\"id\":\"67ec1f50-a5ee-11ec-aa10-992297d21a2e\",\"type\":\"positive_only\",\"field\":\"541ed8f0-a5ee-11ec-aa10-992297d21a2e\"}],\"separate_axis\":0,\"axis_position\":\"right\",\"formatter\":\"number\",\"chart_type\":\"line\",\"line_width\":1,\"point_size\":1,\"fill\":0.5,\"stacked\":\"none\",\"label\":\"indexing_rate\",\"type\":\"timeseries\",\"split_filters\":[{\"color\":\"#68BC00\",\"id\":\"81004200-a5ee-11ec-aa10-992297d21a2e\",\"filter\":{\"query\":\"\",\"language\":\"kuery\"}}],\"filter\":{\"query\":\"\",\"language\":\"kuery\"},\"terms_field\":\"index_stats.index\",\"terms_order_by\":\"61ca57f2-469d-11e7-af02-69e470af7417\",\"terms_size\":\"10\",\"terms_direction\":\"desc\",\"split_color_mode\":\"rainbow\"}],\"time_field\":\"timestamp\",\"index_pattern\":\"monitoring-eye-css-*\",\"interval\":\"\",\"axis_position\":\"left\",\"axis_formatter\":\"number\",\"axis_scale\":\"normal\",\"show_legend\":1,\"show_grid\":1,\"default_index_pattern\":\"monitoring-eye-css-*\",\"default_timefield\":\"timestamp\",\"isModelInvalid\":false,\"tooltip_mode\":\"show_all\"}}"},"id":"943b3e00-a5ef-11ec-9a68-ada9d754c566","references":[],"type":"visualization","updated_at":"2022-12-01T12:41:01.165Z","version":"WzIxNCwyXQ=="}{"attributes":{"description":"","kibanaSavedObjectMeta":{"searchSourceJSON":"{}"},"title":"[monitoring] search rate of index for top10(/s)","uiStateJSON":"{}","version":1,"visState":"{\"title\":\"[monitoring] search rate of index for top10(/s)\",\"type\":\"metrics\",\"aggs\":[],\"params\":{\"id\":\"61ca57f0-469d-11e7-af02-69e470af7417\",\"type\":\"timeseries\",\"series\":[{\"id\":\"61ca57f1-469d-11e7-af02-69e470af7417\",\"color\":\"rgba(99,157,12,1)\",\"split_mode\":\"terms\",\"metrics\":[{\"id\":\"61ca57f2-469d-11e7-af02-69e470af7417\",\"type\":\"max\",\"field\":\"index_stats.total.search.query_total\"},{\"unit\":\"1s\",\"id\":\"fdfdfad0-a5ef-11ec-aa10-992297d21a2e\",\"type\":\"derivative\",\"field\":\"61ca57f2-469d-11e7-af02-69e470af7417\"},{\"unit\":\"\",\"id\":\"0aaa26a0-a5f0-11ec-aa10-992297d21a2e\",\"type\":\"positive_only\",\"field\":\"fdfdfad0-a5ef-11ec-aa10-992297d21a2e\"}],\"separate_axis\":0,\"axis_position\":\"right\",\"formatter\":\"number\",\"chart_type\":\"line\",\"line_width\":1,\"point_size\":1,\"fill\":0.5,\"stacked\":\"none\",\"label\":\"search rate\",\"type\":\"timeseries\",\"terms_field\":\"index_stats.index\",\"terms_order_by\":\"61ca57f2-469d-11e7-af02-69e470af7417\",\"split_color_mode\":\"rainbow\"}],\"time_field\":\"timestamp\",\"index_pattern\":\"monitoring-eye-css-*\",\"interval\":\"\",\"axis_position\":\"left\",\"axis_formatter\":\"number\",\"axis_scale\":\"normal\",\"show_legend\":1,\"show_grid\":1,\"default_index_pattern\":\"monitoring-eye-css-*\",\"default_timefield\":\"timestamp\",\"isModelInvalid\":false,\"tooltip_mode\":\"show_all\"}}"},"id":"ab503550-a5ef-11ec-9a68-ada9d754c566","references":[],"type":"visualization","updated_at":"2022-12-01T12:41:01.165Z","version":"WzIxNSwyXQ=="}{"attributes":{"description":"","kibanaSavedObjectMeta":{"searchSourceJSON":"{}"},"title":"[monitoring] indices store_size for top10","uiStateJSON":"{}","version":1,"visState":"{\"title\":\"[monitoring] indices store_size for top10\",\"type\":\"metrics\",\"aggs\":[],\"params\":{\"id\":\"61ca57f0-469d-11e7-af02-69e470af7417\",\"type\":\"timeseries\",\"series\":[{\"id\":\"38474c50-a5f5-11ec-aa10-992297d21a2e\",\"color\":\"#68BC00\",\"split_mode\":\"terms\",\"metrics\":[{\"id\":\"38474c51-a5f5-11ec-aa10-992297d21a2e\",\"type\":\"max\",\"field\":\"index_stats.total.store.size_in_bytes\"}],\"separate_axis\":0,\"axis_position\":\"right\",\"formatter\":\"bytes\",\"chart_type\":\"line\",\"line_width\":1,\"point_size\":1,\"fill\":0.5,\"stacked\":\"none\",\"label\":\"store_size for index\",\"type\":\"timeseries\",\"terms_field\":\"index_stats.index\",\"terms_order_by\":\"38474c51-a5f5-11ec-aa10-992297d21a2e\",\"filter\":{\"query\":\"\",\"language\":\"kuery\"},\"split_color_mode\":\"rainbow\"}],\"time_field\":\"timestamp\",\"index_pattern\":\"monitoring-eye-css-*\",\"interval\":\"\",\"axis_position\":\"left\",\"axis_formatter\":\"number\",\"axis_scale\":\"normal\",\"show_legend\":1,\"show_grid\":1,\"default_index_pattern\":\"monitoring-eye-css-*\",\"default_timefield\":\"timestamp\",\"isModelInvalid\":false,\"filter\":{\"query\":\"\",\"language\":\"kuery\"},\"bar_color_rules\":[{\"id\":\"7d9d3cb0-a5f5-11ec-aa10-992297d21a2e\"}],\"tooltip_mode\":\"show_all\"}}"},"id":"c78119a0-a5f5-11ec-9a68-ada9d754c566","references":[],"type":"visualization","updated_at":"2022-12-01T12:41:01.165Z","version":"WzIxNiwyXQ=="}{"attributes":{"description":"","kibanaSavedObjectMeta":{"searchSourceJSON":"{}"},"title":"[monitoring] search query time in millis of index for top10(ms)","uiStateJSON":"{}","version":1,"visState":"{\"title\":\"[monitoring] search query time in millis of index for top10(ms)\",\"type\":\"metrics\",\"aggs\":[],\"params\":{\"axis_formatter\":\"number\",\"axis_max\":\"\",\"axis_min\":\"\",\"axis_position\":\"left\",\"axis_scale\":\"normal\",\"default_index_pattern\":\"monitoring-eye-css-*\",\"default_timefield\":\"timestamp\",\"id\":\"61ca57f0-469d-11e7-af02-69e470af7417\",\"index_pattern\":\"monitoring-eye-css-*\",\"interval\":\"\",\"isModelInvalid\":false,\"series\":[{\"axis_position\":\"right\",\"chart_type\":\"line\",\"color\":\"#68BC00\",\"fill\":0.5,\"formatter\":\"number\",\"id\":\"61ca57f1-469d-11e7-af02-69e470af7417\",\"label\":\"index_query_time_in_millis\",\"line_width\":1,\"metrics\":[{\"field\":\"index_stats.total.search.query_time_in_millis\",\"id\":\"61ca57f2-469d-11e7-af02-69e470af7417\",\"type\":\"max\"},{\"unit\":\"1s\",\"id\":\"42c92b10-6645-11ed-925a-6de90846447d\",\"type\":\"derivative\",\"field\":\"61ca57f2-469d-11e7-af02-69e470af7417\"}],\"point_size\":1,\"separate_axis\":0,\"split_color_mode\":\"kibana\",\"split_mode\":\"terms\",\"stacked\":\"none\",\"terms_field\":\"index_stats.index\",\"terms_order_by\":\"61ca57f2-469d-11e7-af02-69e470af7417\",\"type\":\"timeseries\"}],\"show_grid\":1,\"show_legend\":1,\"time_field\":\"timestamp\",\"tooltip_mode\":\"show_all\",\"type\":\"timeseries\",\"background_color\":null,\"filter\":{\"query\":\"\",\"language\":\"kuery\"},\"legend_position\":\"right\"}}"},"id":"c8109100-6627-11ed-8cd7-973626cf6f70","references":[],"type":"visualization","updated_at":"2022-12-01T12:41:01.165Z","version":"WzIxNywyXQ=="}{"attributes":{"description":"","hits":0,"kibanaSavedObjectMeta":{"searchSourceJSON":"{\"query\":{\"language\":\"kuery\",\"query\":\"\"},\"filter\":[]}"},"optionsJSON":"{\"hidePanelTitles\":false,\"useMargins\":true}","panelsJSON":"[{\"gridData\":{\"x\":0,\"y\":0,\"w\":48,\"h\":5,\"i\":\"971ed6c6-81b9-491b-9f08-e3ae9c382abd\"},\"panelIndex\":\"971ed6c6-81b9-491b-9f08-e3ae9c382abd\",\"embeddableConfig\":{},\"panelRefName\":\"panel_0\"},{\"gridData\":{\"x\":0,\"y\":5,\"w\":24,\"h\":15,\"i\":\"5a6982e7-0c6c-4733-8a2d-e4c57cdf7397\"},\"panelIndex\":\"5a6982e7-0c6c-4733-8a2d-e4c57cdf7397\",\"embeddableConfig\":{},\"panelRefName\":\"panel_1\"},{\"gridData\":{\"x\":24,\"y\":5,\"w\":24,\"h\":15,\"i\":\"662476f4-739c-4a05-858c-2ee8230cf410\"},\"panelIndex\":\"662476f4-739c-4a05-858c-2ee8230cf410\",\"embeddableConfig\":{},\"panelRefName\":\"panel_2\"},{\"gridData\":{\"x\":0,\"y\":20,\"w\":16,\"h\":15,\"i\":\"d89c38e2-33f3-4592-b503-20460a6a7a57\"},\"panelIndex\":\"d89c38e2-33f3-4592-b503-20460a6a7a57\",\"embeddableConfig\":{},\"panelRefName\":\"panel_3\"},{\"gridData\":{\"x\":16,\"y\":20,\"w\":16,\"h\":15,\"i\":\"1f693b49-79fa-4807-94e8-0c12f51e54f8\"},\"panelIndex\":\"1f693b49-79fa-4807-94e8-0c12f51e54f8\",\"embeddableConfig\":{},\"panelRefName\":\"panel_4\"},{\"gridData\":{\"x\":32,\"y\":20,\"w\":16,\"h\":15,\"i\":\"616b143d-74e9-4dac-98ba-5849536f0fba\"},\"panelIndex\":\"616b143d-74e9-4dac-98ba-5849536f0fba\",\"embeddableConfig\":{},\"panelRefName\":\"panel_5\"},{\"gridData\":{\"x\":0,\"y\":35,\"w\":24,\"h\":11,\"i\":\"cfa82f27-1b8d-49ba-a7b9-d8809d3b258c\"},\"panelIndex\":\"cfa82f27-1b8d-49ba-a7b9-d8809d3b258c\",\"embeddableConfig\":{},\"panelRefName\":\"panel_6\"},{\"gridData\":{\"x\":24,\"y\":35,\"w\":24,\"h\":11,\"i\":\"135d13eb-aab6-43ca-9029-7d26e91d90e3\"},\"panelIndex\":\"135d13eb-aab6-43ca-9029-7d26e91d90e3\",\"embeddableConfig\":{},\"panelRefName\":\"panel_7\"},{\"gridData\":{\"x\":0,\"y\":46,\"w\":24,\"h\":11,\"i\":\"28a77de1-9110-49e8-b273-724f880b1653\"},\"panelIndex\":\"28a77de1-9110-49e8-b273-724f880b1653\",\"embeddableConfig\":{},\"panelRefName\":\"panel_8\"},{\"gridData\":{\"x\":24,\"y\":46,\"w\":24,\"h\":11,\"i\":\"80ece867-cf23-4935-bfbc-430afa51bcca\"},\"panelIndex\":\"80ece867-cf23-4935-bfbc-430afa51bcca\",\"embeddableConfig\":{},\"panelRefName\":\"panel_9\"},{\"gridData\":{\"x\":0,\"y\":57,\"w\":24,\"h\":11,\"i\":\"2ba970aa-c9c4-491b-bdd3-c1b1ee9bc8d3\"},\"panelIndex\":\"2ba970aa-c9c4-491b-bdd3-c1b1ee9bc8d3\",\"embeddableConfig\":{},\"panelRefName\":\"panel_10\"},{\"gridData\":{\"x\":24,\"y\":57,\"w\":24,\"h\":11,\"i\":\"f2e1b6ab-ddf7-492e-aaca-9460f11aa4aa\"},\"panelIndex\":\"f2e1b6ab-ddf7-492e-aaca-9460f11aa4aa\",\"embeddableConfig\":{},\"panelRefName\":\"panel_11\"},{\"gridData\":{\"x\":0,\"y\":68,\"w\":24,\"h\":11,\"i\":\"dd14182d-d8b9-47f2-bf36-6cba3b09586c\"},\"panelIndex\":\"dd14182d-d8b9-47f2-bf36-6cba3b09586c\",\"embeddableConfig\":{},\"panelRefName\":\"panel_12\"},{\"gridData\":{\"x\":24,\"y\":68,\"w\":24,\"h\":11,\"i\":\"a47f9333-52b7-49b7-8cac-f470cf405131\"},\"panelIndex\":\"a47f9333-52b7-49b7-8cac-f470cf405131\",\"embeddableConfig\":{},\"panelRefName\":\"panel_13\"}]","timeRestore":false,"title":"[Monitoring] Index monitoring Dashboard","version":1},"id":"524eb000-a5f2-11ec-9a68-ada9d754c566","references":[{"id":"b2811c70-a5f1-11ec-9a68-ada9d754c566","name":"panel_0","type":"visualization"},{"id":"de4f8ab0-a5f8-11ec-9a68-ada9d754c566","name":"panel_1","type":"visualization"},{"id":"811df7a0-a5f8-11ec-9a68-ada9d754c566","name":"panel_2","type":"visualization"},{"id":"eea89780-664b-11ed-8cd7-973626cf6f70","name":"panel_3","type":"visualization"},{"id":"cfbb4e20-664c-11ed-8cd7-973626cf6f70","name":"panel_4","type":"visualization"},{"id":"c7f72ae0-664e-11ed-8cd7-973626cf6f70","name":"panel_5","type":"visualization"},{"id":"943b3e00-a5ef-11ec-9a68-ada9d754c566","name":"panel_6","type":"visualization"},{"id":"ab503550-a5ef-11ec-9a68-ada9d754c566","name":"panel_7","type":"visualization"},{"id":"c78119a0-a5f5-11ec-9a68-ada9d754c566","name":"panel_8","type":"visualization"},{"id":"225f6020-a5f1-11ec-9a68-ada9d754c566","name":"panel_9","type":"visualization"},{"id":"17d49220-662a-11ed-8cd7-973626cf6f70","name":"panel_10","type":"visualization"},{"id":"c8109100-6627-11ed-8cd7-973626cf6f70","name":"panel_11","type":"visualization"},{"id":"45d571c0-6626-11ed-8cd7-973626cf6f70","name":"panel_12","type":"visualization"},{"id":"3ae5d820-6628-11ed-8cd7-973626cf6f70","name":"panel_13","type":"visualization"}],"type":"dashboard","updated_at":"2022-12-01T12:41:01.165Z","version":"WzIxOCwyXQ=="}{"exportedCount":16,"missingRefCount":0,"missingReferences":[]}